Instruction
These are some basic instructions on how to read and use this document.
There are 3 main indicators that you need to take note of in the document.
They are:
Task
This will contains all the information regarding what you are supposed to do and put into your report, so lookout for them as missing task = deducting point.
Note
This will contain additional note that you should lookout for, extra information or further explanation. This usually pertain to quirk or possible error you might face, so please read through them also.
Warning
This contains special information that we need your attention to or else something will be broken, fail to run or worse COST YOU A LOT OF MONEY.
Part A
This part will consist of:
- Install and configure ParallelCluster (Estimated time: 30 mins)
- Create your cluster (Estimated time: 15 mins)
- Test your cluster (Estimated time: 15 mins)
- Shut down your cluster (Estimated time: 15 mins)
- Track your AWS usage (Estimated time: 5 mins)
Task
Submit the following task for lab report for Part A:
before:
the end of the lab session at 2 pm on August 25th (Monday)
in PDF format only to the Lab 3A folder, and name the file
Lab3A_YourName.pdf
Part 1. Install and configure ParallelCluster
Note
For WINDOWS USERS:
Please proceed with the rest of this lab in WSL, unless stated otherwise. Please install the Linux version of miniconda in WSL and create a conda environment called aws using the command in Step 6 of Lab 2 and activate the environment before starting on this lab. If after installing miniconda and creating a new Terminal window does not show the "(base)" prompt, you might have to do the following:
cd ~/
ln -s ~/.bashrc ~/.bash_profile
before creating a new Terminal window again.
1.
Use pip to install the AWS ParallelCluster software:
(aws) $ pip install aws-parallelcluster --upgrade --user
2.
You will also need to install nvm, a version manager for Node.js here, as it is used by AWS ParallelCluster CLI.
Scroll to the section on Installing and Updating to install nvm. You might need to reload the .bashrc (or equivalent file if you are not using the bash shell) file after installation by doing:
(aws) $ source ~/.bashrc
Once you are done, you can do the following to check that nvm is installed properly:
(aws) $ nvm --version

0.40.3
You can now use nvm to install Node.js:
(aws) $ nvm install node
You can do the following to make sure it is installed properly:
(aws) $ node --version

v24.6.0
3.
Edit your shell’s config file (e.g. ~/.bash_profile, ~/.zshrc, ~/.bashrc) using the nano editor:
(aws) $ nano ~/.bash_profile
to add pcluster’s directory ~/.local/bin to your shell’s $PATH variable by adding the following line at the end of the file:
export PATH="/Users/shihcheng/.local/bin:$PATH"
Note
Replace the portions
/Users/shihcheng/of the path with those appropriate for your home directory. To do that you should:$ cd ~ $ pwd /your/home/directory/path
Save and exit the nano editor by typing Ctrl-x, followed by y to save the file, and Return to use the same filename.
4.
Reload your shell’s config file (replace with .zshrc or .bashrc as necessary):
(aws) $ source ~/.bash_profile
or:
(aws) $ . ~/.bash_profile
This will reset your conda environment, so you should reactivate your aws environment:
(base) $ conda activate aws
5.
Check that you can run pcluster, and get the version number returned:
(aws) $ pcluster version

{
  "version": "3.11.1"
}
6.
You will now create a configuration file for pcluster in your home directory:
(aws) $ pcluster configure --config ~/cluster-config.yaml
Select these answers to the prompts:
AWS Region ID: ap-southeast-1
EC2 Key Pair Name: MyKeyPair
Scheduler: slurm
Operating System: alinux2
Head node instance type: t2.micro
Number of queues: 1
Name of queue 1: queue1
Number of compute resources for queue1: 1
Compute instance type for compute resource 1 in queue1: t2.micro
Maximum instance count: 10
Automate VPC creation? (y/n): y
Availability Zone: ap-southeast-1a
Network Configuration: Head node and compute fleet in the same public subnet
Wait until the program completes the setup.
7.
Edit the configuration file created by the command above:
(aws) $ nano ~/cluster-config.yaml
8.
In the HeadNode section, find the entry for InstanceType:
HeadNode:
  InstanceType: t2.micro
9.
In order to avoid running out of one particular type of instance, insert the instance type from the table below according to the last number before the letter in your student number (e.g. use the number 4 if your student number is A0171234X):
| Number | Instance Type | Number | Instance Type | Number | Instance Type |
|---|---|---|---|---|---|
| 0 | t3a.nano | 4 | t3.micro | 8 | t3.medium |
| 1 | t3.nano | 5 | t3a.small | 9 | c5a.large |
| 2 | t2.nano | 6 | t3.small | ||
| 3 | t3a.micro | 7 | t3a.medium |
10.
Do the same for Name and InstanceType in the Scheduling section:
Scheduling:
  Scheduler: slurm
  SlurmQueues:
  - Name: queue1
    ComputeResources:
    - Name: t3a-nano
      InstanceType: t3a.nano
Warning
The
Namefield can only take letters, digits, and hyphens, so replace the period in the instance type with a hyphen when entering it into theNamefield, e.g.t3a-nanoinstead oft3a.nano.
11.
Add the following after the Scheduling section (use copy and paste to avoid typos):
SharedStorage:
  - MountDir: data
    Name: ee3801
    StorageType: Ebs
    EbsSettings:
      Size: 1000
      Encrypted: false
      SnapshotId:
Leave the SnapshotId field empty for now. You will enter this information later after you have created a copy of the snapshot we have created for you. This will give you access to the data you will be processing for the remaining labs, which is stored as a Elastic Block Storage snapshot on AWS. The MountDir setting means that the files and directories in the snapshot can be found in the /data directory on your cluster.
12.
Some AWS Organization accounts block creating Route 53 hosted zones. ParallelCluster tries to create a private hosted zone by default, which will cause Step 16 to fail with AWS::Route53::HostedZone CREATE_FAILED (AccessDenied).
To prevent this, disable managed DNS in your config now:
- Edit
~/cluster-config.yaml. - Under
Scheduling, insert the following block exactly underSlurmSettings(indentation matters):
Scheduling:
  Scheduler: slurm
  SlurmSettings:
    Dns:
      DisableManagedDns: true
      UseEc2Hostnames: true
Note
Heads-up: after disabling managed DNS, when you start an interactive compute shell with
srun --pty /bin/bashin step 47, your prompt will show the default EC2 hostname (e.g. ip-10-0-10-43) instead of a Slurm node alias (e.g. queue1-dy-m54xlarge-1).
Check your config file by doing:
(aws) $ cat ~/cluster-config.yaml
which should look like the following (except the instance type should follow the instructions from above):
Region: ap-southeast-1
Image:
  Os: alinux2
HeadNode:
  InstanceType: t3a.nano
  Networking:
    SubnetId: subnet-xxxxxxxxxxxxxxxxx
  Ssh:
    KeyName: MyKeyPair
Scheduling:
  Scheduler: slurm
  SlurmSettings:
    Dns:
      DisableManagedDns: true
      UseEc2Hostnames: true
  SlurmQueues:
  - Name: queue1
    ComputeResources:
    - Name: t3a-nano
      InstanceType: t3a.nano
      MinCount: 0
      MaxCount: 10
    Networking:
      SubnetIds:
      - subnet-xxxxxxxxxxxxxxxxx
SharedStorage:
  - MountDir: data
    Name: ee3801
    StorageType: Ebs
    EbsSettings:
      Size: 1000
      Encrypted: false
      SnapshotId:
Check carefully for typos as they will cause problems in the subsequent steps.
13.
Before we create a cluster, which might take 10 minutes or more depending on how busy AWS is, we will use the Simple Notification System on AWS to notify you when the cluster is ready:
(aws) $ aws sns create-topic --name awsnotify
which should return something like the following (with a different AWS ID number):
{
    "TopicArn": "arn:aws:sns:ap-southeast-1:123456789012:awsnotify"
}
Copy the TopicArn number (123456789012 in the example above) created for you so you can use it in the subsequent commands.
Subscribe to the topic by using the following command (which should be entered in one line with no line breaks, paste the TopicArn number above into the command below, and change the email address abcde@nus.edu.sg to your email address):
(aws) $ aws sns subscribe --topic-arn arn:aws:sns:ap-southeast-1:123456789012:awsnotify --protocol email --notification-endpoint abcde@nus.edu.sg

{
    "SubscriptionArn": "pending confirmation"
}
You should then receive a subscription confirmation email with a link that you can click to confirm your subscription.
You can then send a test message by doing (replace the TopicArn number):
(aws) $ aws sns publish --topic-arn arn:aws:sns:ap-southeast-1:123456789012:awsnotify --message "test"

{
    "MessageId": "2fb0a38d-2aeb-5336-a517-fa374b3c7ce4"
}
Check your email to see that you received the test message successfully to verify that the notification system has been set up properly.
We can create a shell function to make it easier to send notifications by adding the following to the end of your shell config file (e.g. ~/.bash_profile, ~/.bashrc, ~/.zshrc, etc.):
awsnotify() {
	aws sns publish --topic-arn arn:aws:sns:ap-southeast-1:123456789012:awsnotify --message "$1"
}
Reload the configuration file by doing:
(aws) $ source ~/.bash_profile

(base) $ conda activate aws
and test it by doing:
(aws) $ awsnotify test2
If you receive an email with the message test2 after a few minutes, it means you have successfully created a shell function to make sending AWS notifications easier.
14.
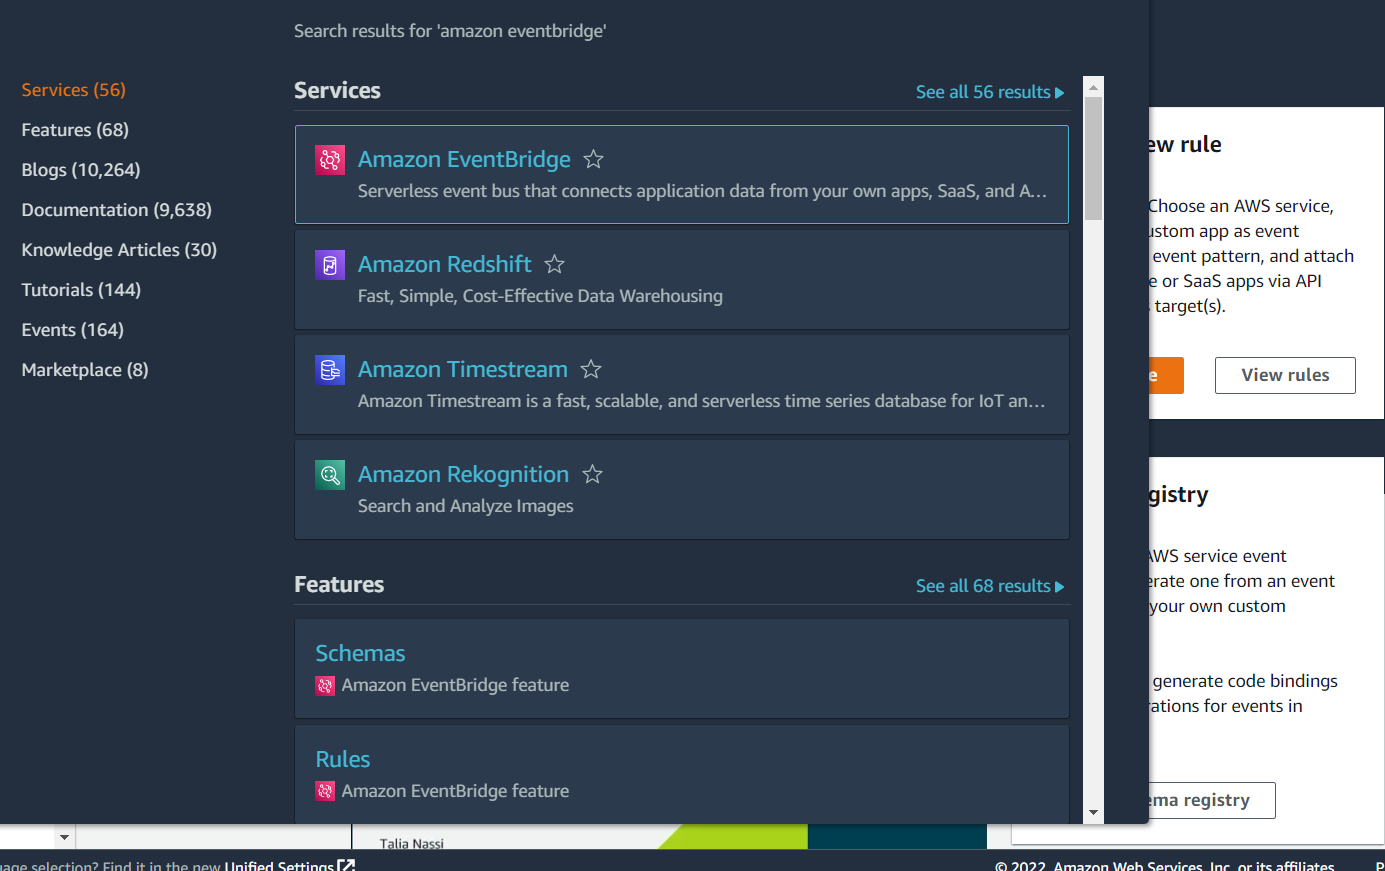
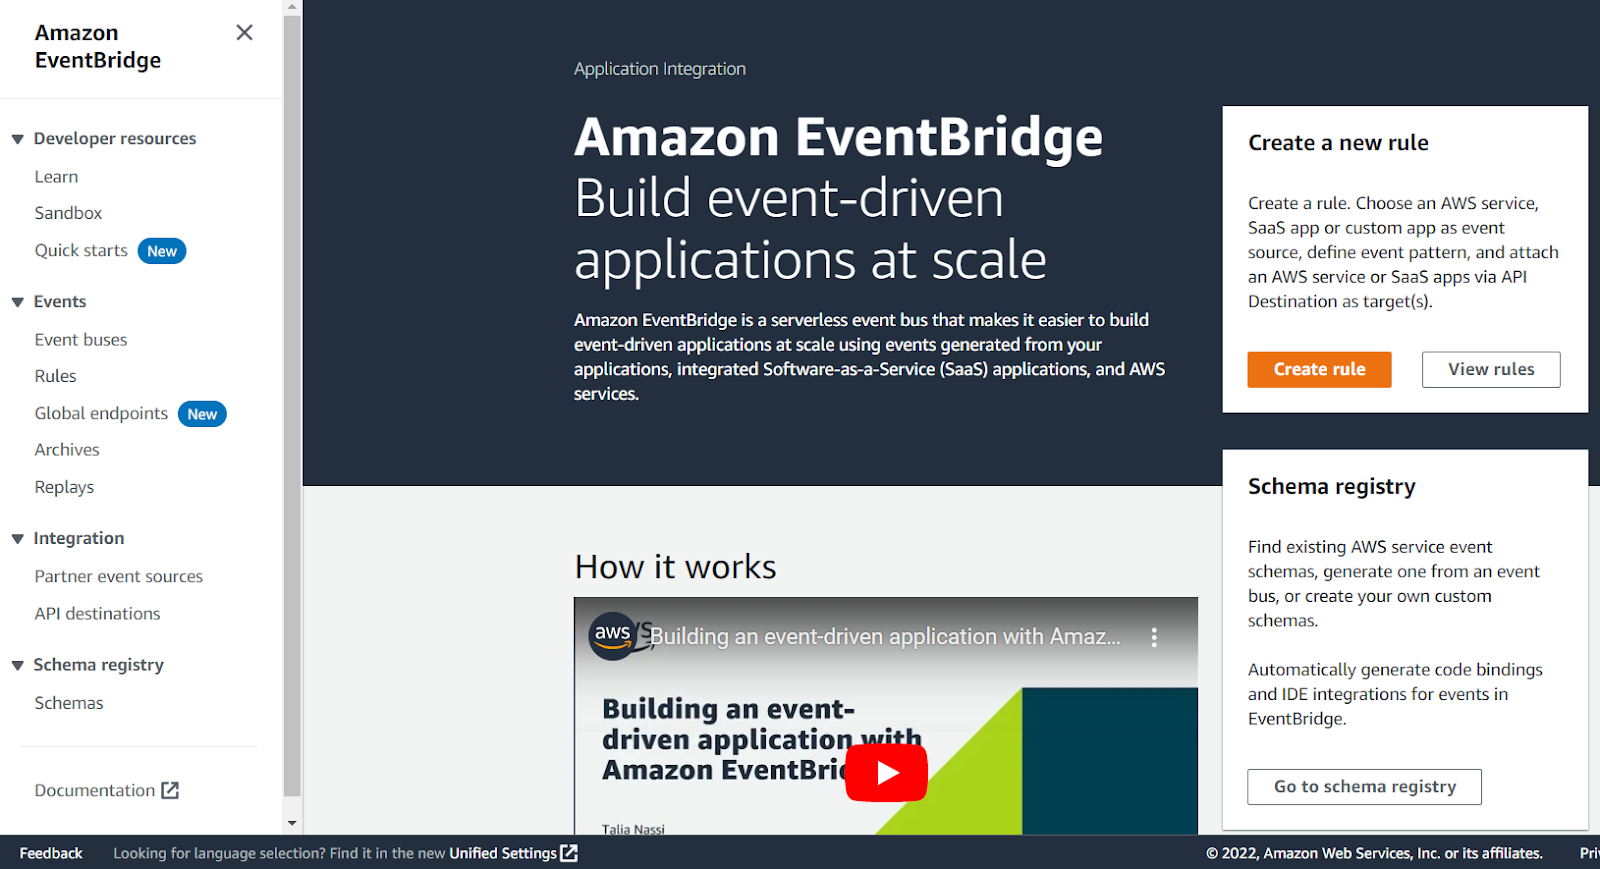
We will now use the EventBridge service in AWS to notify you once your cluster is set up, so login to your AWS console.
Type Amazon EventBridge into the search bar at the top, and click on Amazon EventBridge in the drop-down list:
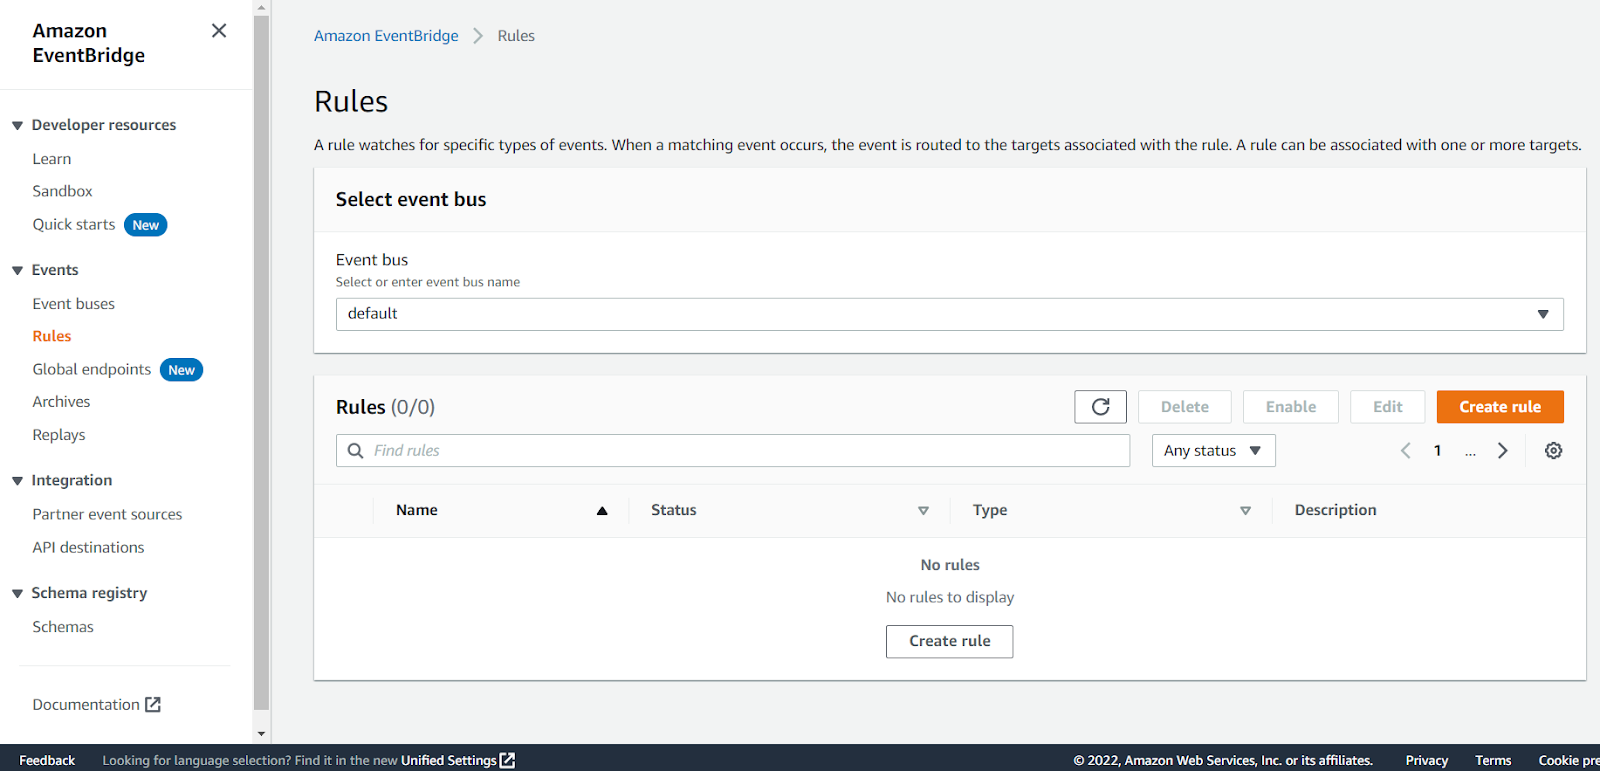
Click on Rules in the panel on the left:
Click on the Create rule button:
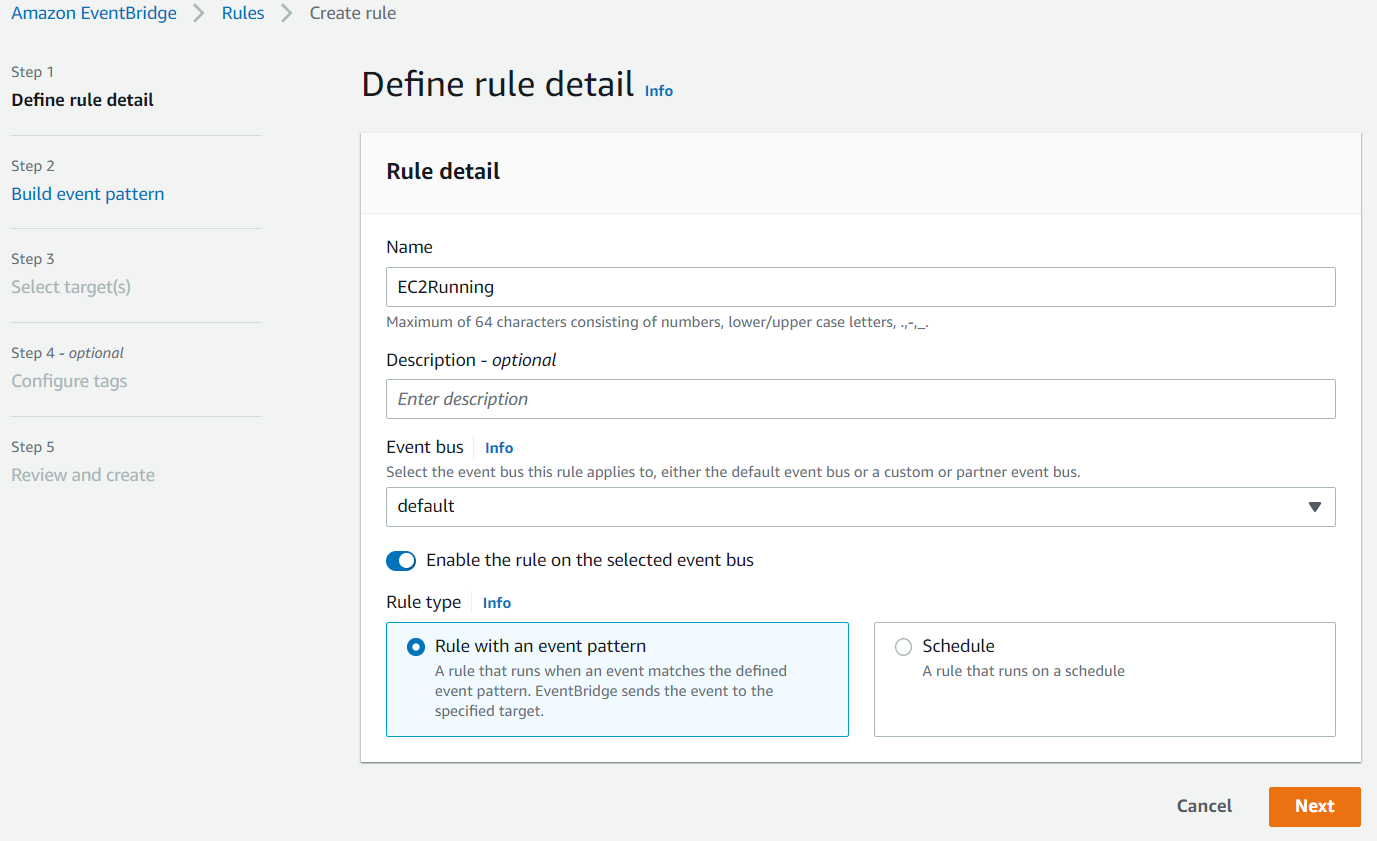
Enter something like EC2Running in the Name field and click Next:
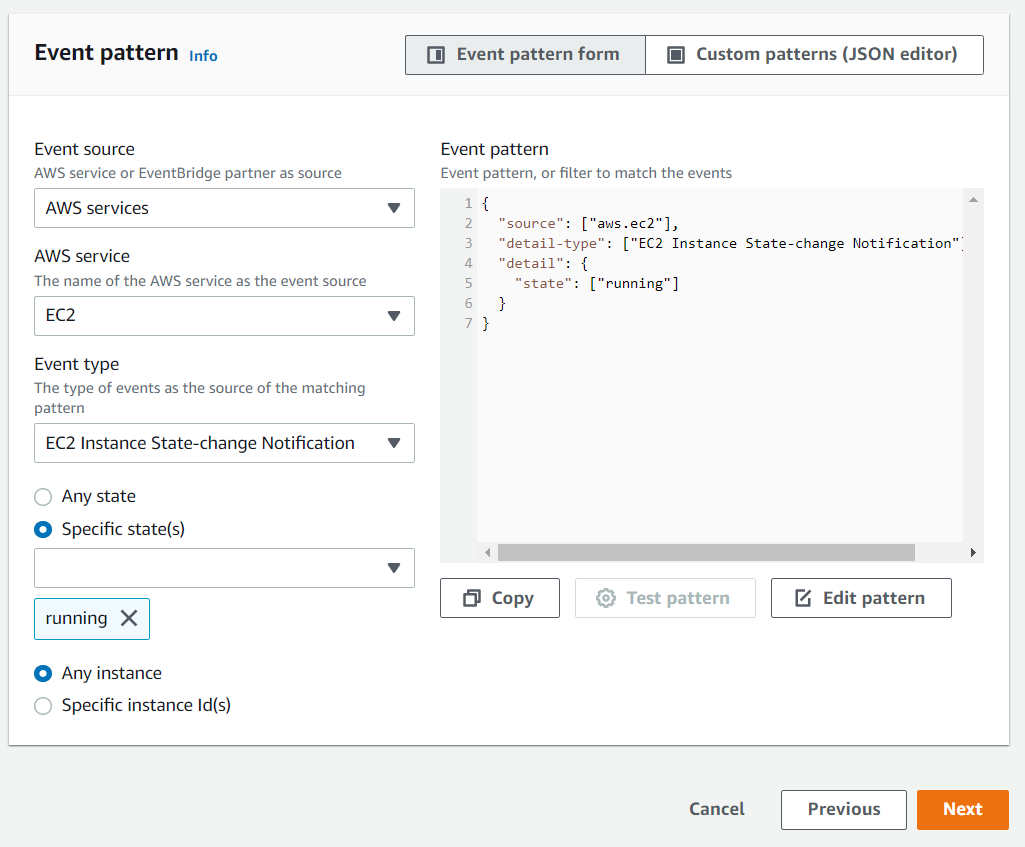
Scroll down to the Event pattern section. Under the AWS service section, select EC2 from the drop-down list, EC2 Instance State-change Notification from the Event Type drop-down list, select the Specific state(s) option, and select running from the drop-down list, and click Next:
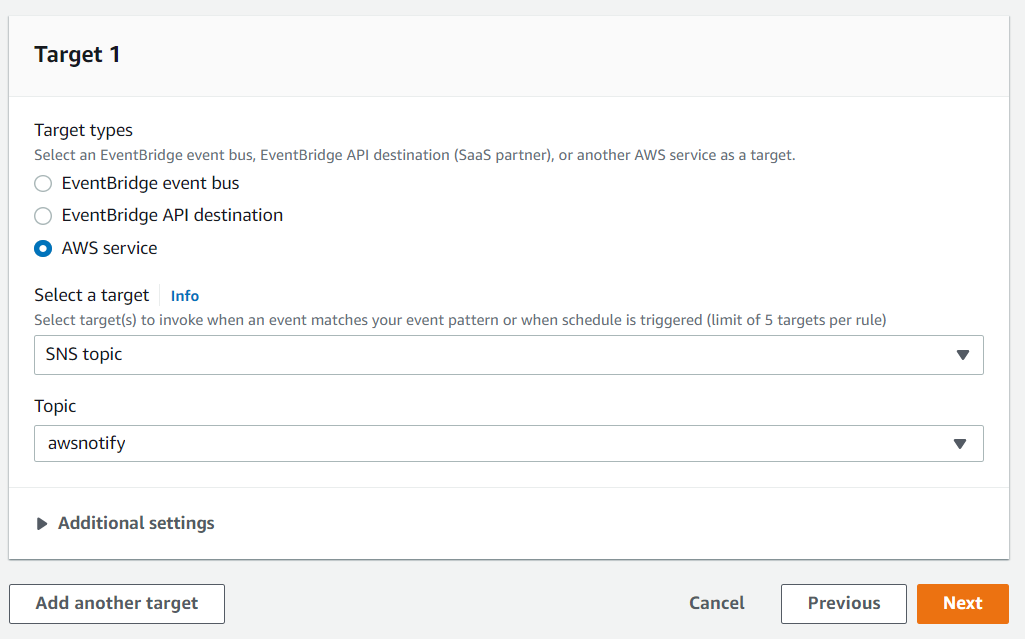
Under the Target section, select SNS topic from the first drop-down list and awsnotify from the Topic drop-down list, then click Next:
Click Next for the Configure tags section, then click Create rule.
You will now receive an email notification whenever an EC2 instance switches state into the running state, which is when the instance is ready for use.
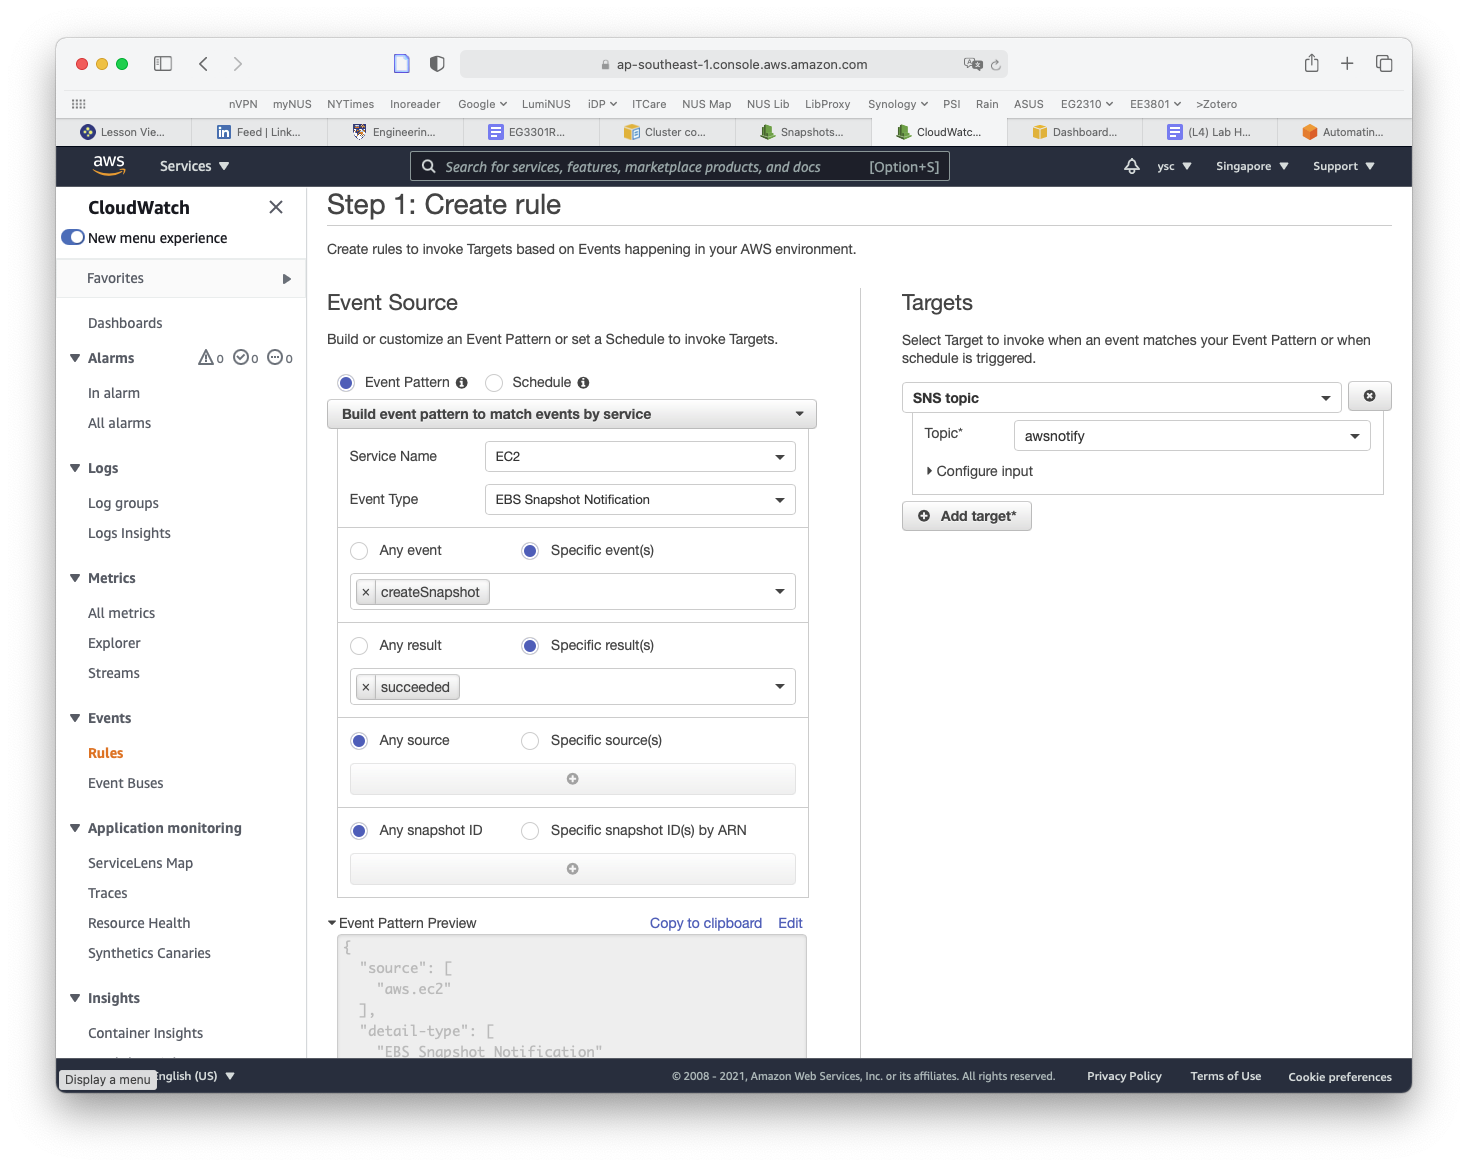
While you are here, we will set up another rule to notify you when EC2 snapshots are completed, which you will use later to back up your work. Click on the Create rule button again from the Rules landing page. This time, type SnapshotComplete for the rule name, select EC2 for Service Name, EBS Snapshot Notification for Event Type, createSnapshot for Specific event(s), and succeeded for Specific result(s) (as shown below). Check that the same options as above are selected under the Target section. Then click on the Create rule button.
You will now also receive an email when a snapshot is completed.
15.
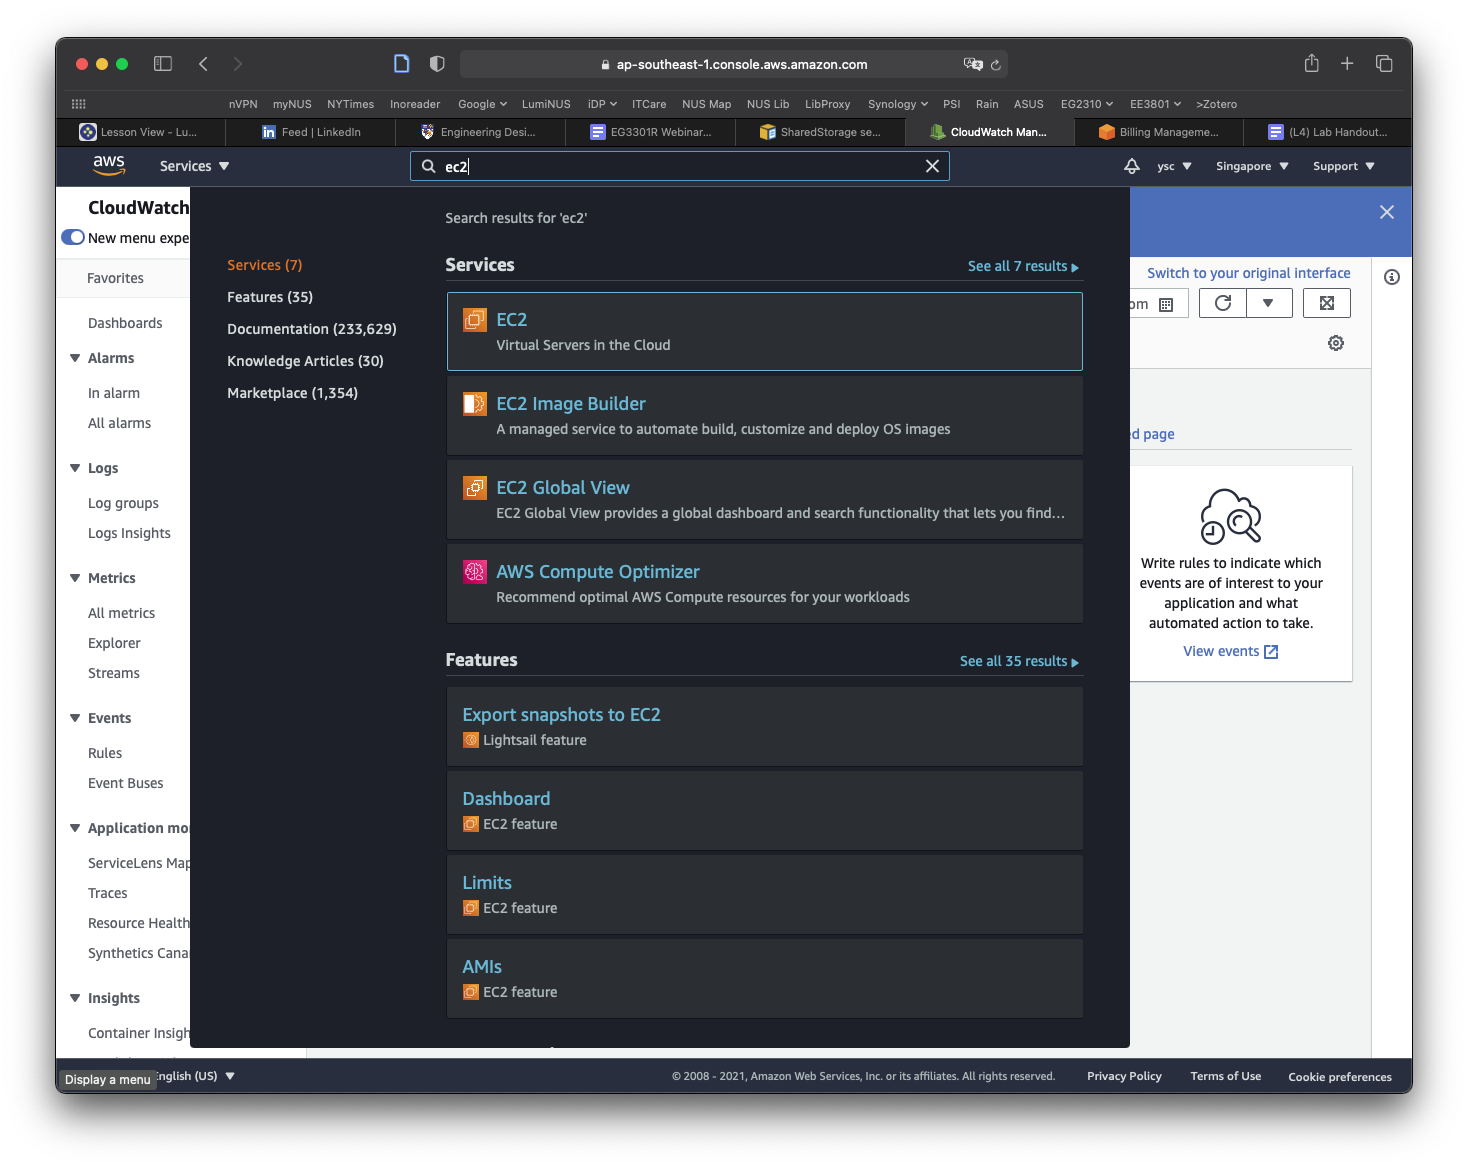
The final thing you will have to do before you create your cluster is to make a copy of the snapshot containing the data that you will be working with for the remaining labs. You can find the snapshot by typing EC2 into the search bar and select EC2 in the drop-down list:
Click Snapshots in the left panel:
Click on the Owned By Me button to reveal the drop-down menu and select Public Snapshots. Copy and paste the following snapshot id: snap-0e87df4e208383a50, and then hit Return. You should see a snapshot with the description condaenvs listed and selected.
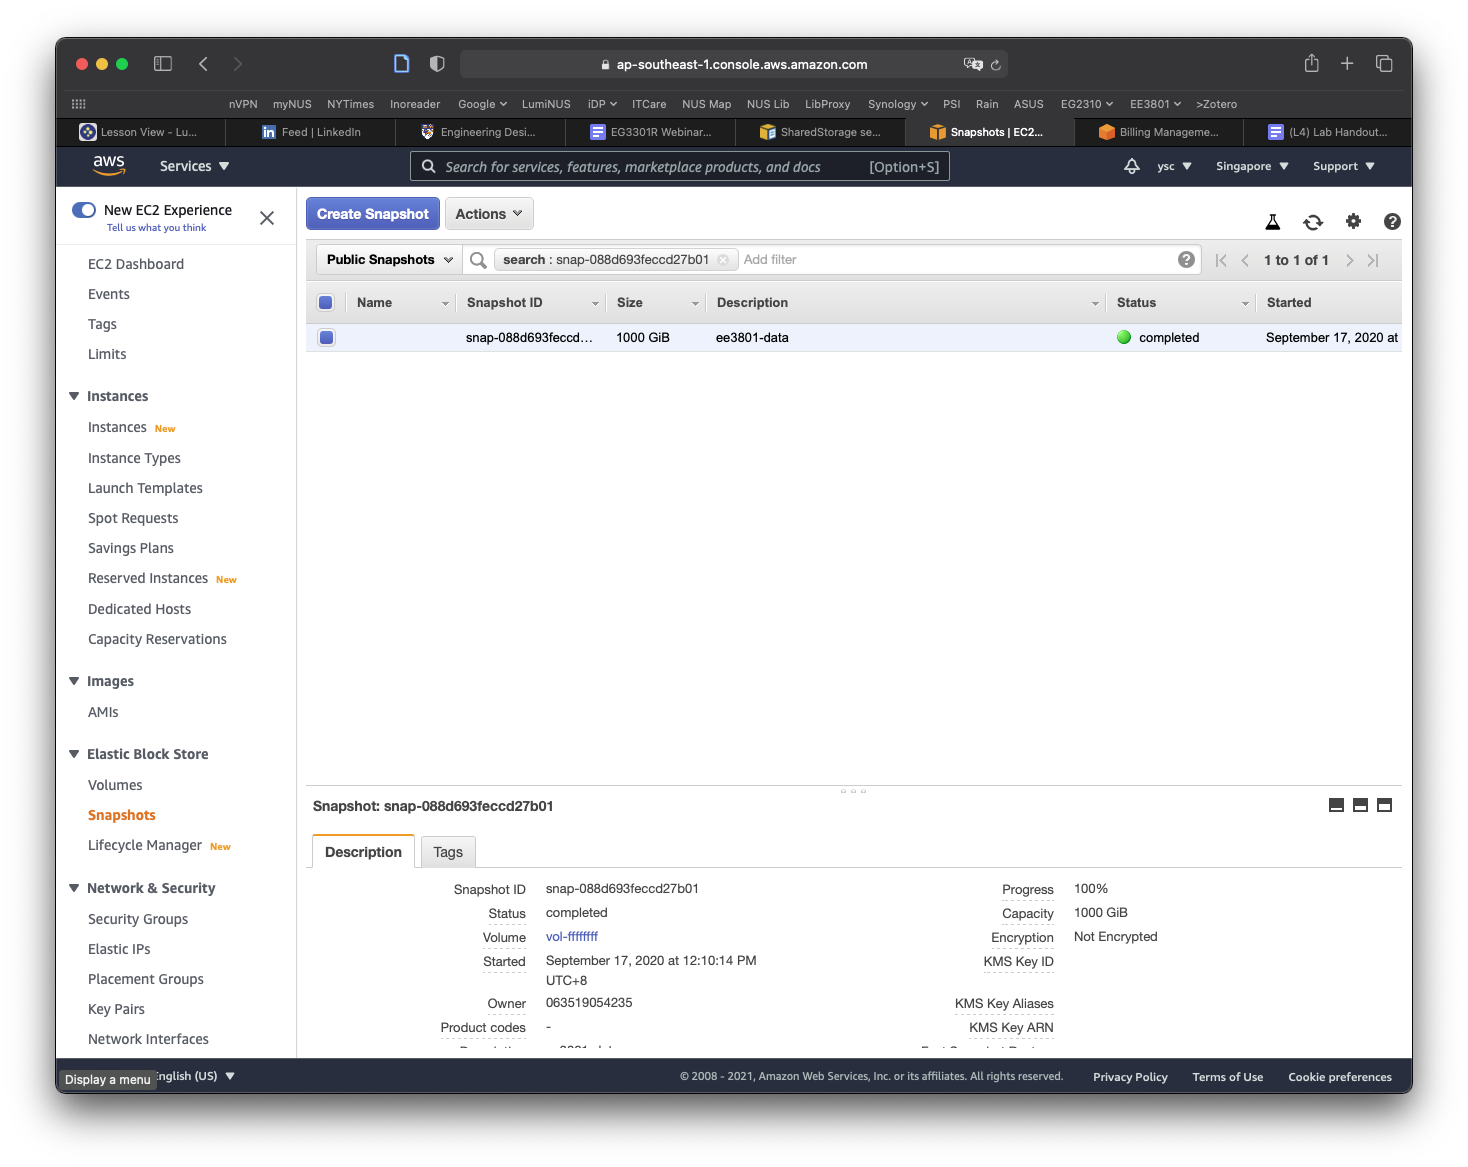
Click on the Actions button, and select the Copy command. In the window that appears, replace the description with data, make sure the Encrypt this snapshot option is NOT selected, and then click the Copy button. You should see a message that the snapshot is being copied.
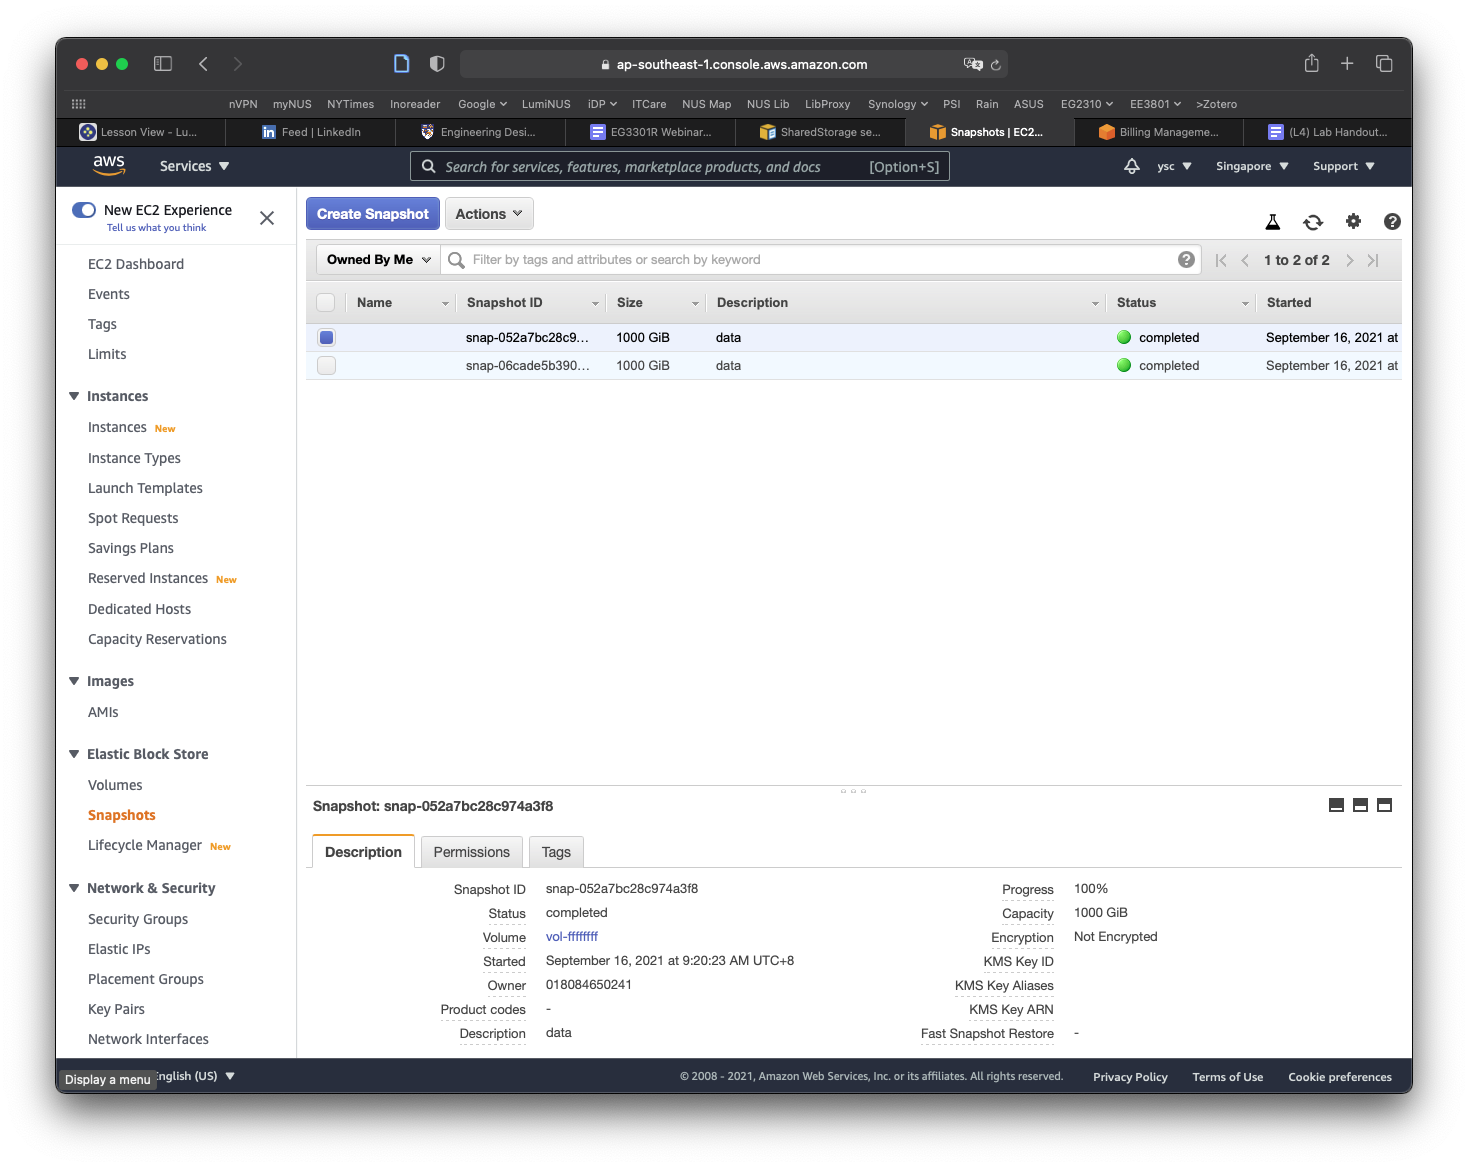
Click on the Public Snapshots button to select the Owned By Me option, and then click on the x icon in the search field to remove the snapshot id. You should now see a snapshot with a size of 1000 GiB with the description data. If the snapshot is not selected, select it, and you should see more information for the snapshot shown in the panel at the bottom of the window. Move your cursor over the text Snapshot ID, which will cause a Copy to clipboard icon to appear. Click on it to copy the Snapshot ID.
Use nano to edit the cluster-config.yaml file and paste the Snapshot ID into the SnapshotId field (be sure to add a space after SnapshotId:):
SharedStorage:
  - MountDir: data
    Name: ee3801
    StorageType: Ebs
    EbsSettings:
      Size: 1000
      Encrypted: false
      SnapshotId: snap-xxxxxxxxxxxxxxxxx
Task
Take a screenshot of your Nano window showing the
SnapshotIDabove and include it in your lab report.
Save the file and exit nano.
Part 2. Create your cluster
16.
You are now ready to create a cluster, which you can do by using the following command:
(aws) $ pcluster create-cluster --cluster-configuration ~/cluster-config.yaml --cluster-name MyCluster01

{
  "cluster": {
    "clusterName": "MyCluster01",
    "cloudformationStackStatus": "CREATE_IN_PROGRESS",
    "cloudformationStackArn": "arn:aws:cloudformation:ap-southeast-1:018084650241:stack/MyCluster01/83b84c40-1516-11ec-a595-0a9f0bd03f38",
    "region": "ap-southeast-1",
    "version": "3.0.0",
    "clusterStatus": "CREATE_IN_PROGRESS"
  }
}
The command can be abbreviated by using "-c" for "--cluster-configuration" and "-n" for "--cluster-name" so the command becomes "pcluster create-cluster -c ~/cluster-config.yaml -n MyCluster01".
You can check on the status of the cluster creation by doing:
(aws) $ pcluster describe-cluster -n MyCluster01
which will return something similar to:
{
  "creationTime": "2021-09-14T04:44:58.676Z",
  "headNode": {
    "launchTime": "2021-09-14T04:48:02.000Z",
    "instanceId": "i-0b5957cf05fcabb63",
    "publicIpAddress": "18.141.164.218", <-- [take note of this]
    "instanceType": "t3a.nano",
    "state": "running",
    "privateIpAddress": "10.0.4.176"
  },
  "version": "3.0.0",
  "clusterConfiguration": {
    "url": "https://parallelcluster-1524b7ec17c70fc0-v1-do-not-delete.s3.ap-southeast-1.amazonaws.com/parallelcluster/3.0.0/clusters/mycluster01-m0vc1fkvm0xb9cl5/configs/cluster-config.yaml?versionId=kqVdsexc1mKyEX9V4PGf1fD8FSFvQvrI&AWSAccessKeyId=AKIAQINPN3UAVMJDB4G5&Signature=h%2BE3dnCFQUhfQTM0kgm4fejrsso%3D&Expires=1631598655"
  },
  "tags": [
    {
      "value": "3.0.0",
      "key": "parallelcluster:version"
    }
  ],
  "cloudFormationStackStatus": "CREATE_IN_PROGRESS",
  "clusterName": "MyCluster01",
  "computeFleetStatus": "UNKNOWN",
  "cloudformationStackArn": "arn:aws:cloudformation:ap-southeast-1:018084650241:stack/MyCluster01/83b84c40-1516-11ec-a595-0a9f0bd03f38",
  "lastUpdatedTime": "2021-09-14T04:44:58.676Z",
  "region": "ap-southeast-1",
  "clusterStatus": "CREATE_IN_PROGRESS" <-- [this is the cluster status]
}
Take note of the publicIpAddress (your value will be different) as you will need this later.
If you encounter an error, this might be because the instance type for the head node that you specified is not available. You will have to first delete the cluster (which should only take a couple of minutes so you do not need to set up a notification):
(aws) $ pcluster delete-cluster -n MyCluster01
Check that there are no clusters running:
(aws) $ pcluster list-clusters
You can then try recreating the cluster after editing the config file to use these other instance types:
- t3a.large
- c5.large
- m3.medium
- c5ad.large
- t3.large
- m5a.large
Or other instance types listed here.
You can scroll to the right of the table, and click on the On-Demand Linux pricing to sort by price so you can select the cheaper instances so you do not use up your credits too quickly. You will have to use instance types with x86_64 architecture to avoid running into software errors when using the code we have prepared for you to use on the cluster.
17.
You can take a break and return after you receive the notification email from CloudWatch notifying you that the EC2 instance that is your head node is up and running. Before you login to the cluster, we will copy a file to your cluster first (replace the xx.xx.xx.xx below with the public IP address you obtained above, and replace the PyHipp directory with the one on your computer):
Note
Windows users: Before running the command below, you will need to convert the Windows DOS format of
slurm.shinto unix format by running the following commands (replace thePyHippdirectory with the one on your computer):$ sudo apt-get update $ sudo apt-get install dos2unix $ dos2unix ~/Documents/EE3801/PyHipp/slurm.sh
(aws) $ scp -i ~/MyKeyPair.pem ~/Documents/EE3801/PyHipp/slurm.sh ec2-user@xx.xx.xx.xx:/data/submit.sh
In order to make sure you are specifying the correct path, you can hit the Tab key after you type a few letters of a directory or filename, e.g.
(aws) $ cd ~/Docu

[Hit Tab will get you]
$ cd ~/Documents/
after you type scp -i ~/My, you can hit Tab for the bash shell to auto-complete with the names of files or directories starting with My in your home directory. If you have multiple items starting with My, the auto-completion may not work, but you can hit Tab again to see a list of all the items with names starting with My. You can then continue typing and hit Tab when there is only 1 item that can be auto-completed. If you do not see any items when you hit Tab twice, you are probably specifying the wrong directory.
You should see something similar to the following warning:
The authenticity of host '54.251.188.19 (54.251.188.19)' can't be established.
ECDSA key fingerprint is SHA256:/inHly2x+BukdsWr3kVgVLL2CA/nMSnF8TIHvLl5Pdk.
Are you sure you want to continue connecting (yes/no/[fingerprint])?
Type “yes” and hit Return. You should then see something like:
Warning: Permanently added '54.251.188.19' (ECDSA) to the list of known hosts.
slurm.sh                                      100%  410    75.3KB/s   00:00
This means the file was successfully transferred to your cluster.
If you see the following error instead:
ssh: connect to host 54.251.5.144 port 22: Connection refused
This is probably because the ssh server on the head node is still starting up, so you should just retry the scp command.
18.
Login to the cluster’s head node by using the key pair file you created in Lab 1:
(aws) $ pcluster ssh -i ~/MyKeyPair.pem -n MyCluster01
You should see the following:
Last login: Tue Aug  3 02:52:02 2021

       __|  __|_  )
       _|  (     /   Amazon Linux 2 AMI
      ___|\___|___|

https://aws.amazon.com/amazon-linux-2/
[ec2-user@ip-10-0-0-201 ~]$
This means you are now logged into a Linux computer on AWS.
If you see the following error instead:
ssh: connect to host 54.251.5.144 port 22: Connection refused
This is probably because the ssh server on the head node is still starting up, so you should just retry the ssh command.
19.
You should first enter your AWS credentials using:
[ec2-user@ip-10-0-0-201 ~] $ aws configure
Note that commands preceded by
[ec2-user@ip-10-0-0-201 ~] $
means you should be typing the rest in the shell on AWS which is
aws configure
You should enter your Key ID, Access Key, and the following when prompted:
AWS Access Key ID [None]:
AWS Secret Access Key [None]:
Default region name [None]: ap-southeast-1
Default output format [None]: json
In order to copy and paste your Key ID and Access Key, open another Terminal window on your computer and get your AWS keys by doing the following:
(aws) $ cat ~/.aws/credentials
20.
Check that your AWS credentials are working properly by sending a notification (remember to replace the xxxxxxxxportion below with your AWS account number):
[ec2-user@ip-10-0-0-201 ~] $ aws sns publish --topic-arn arn:aws:sns:ap-southeast-1:xxxxxxxx:awsnotify --message "clustertest"

{
  "MessageId": "2fb0a38d-2aeb-5336-a517-fa374b3c7ce4"
}
21.
Check that you are able to access the data directory with the files and directories from the EBS snapshot:
[ec2-user@ip-10-0-0-201 ~] $ cd /data
If you get an error saying that the directory does not exist, it is possible that the volume has not been mounted yet on your head node, so you can retry after waiting a couple of minutes.
[ec2-user@ip-10-0-0-201 data] $ ls

lost+found  manual_entry.txt  miniconda3  picasso  RCP  src  submit.sh
You should also see the submit.sh file you transferred earlier. Check that you are able to write to the /data directory by modifying a file using the touch command:
[ec2-user@ip-10-0-0-201 data] $ touch manual_entry.txt

[ec2-user@ip-10-0-0-201 data] $ ls

lost+found  manual_entry.txt  miniconda3  picasso  RCP  submit.sh
Part 3. Test your cluster
22.
Go back to the Terminal window you used to login to your cluster’s head node. Check that the submitted jobs are able to access the data by first editing the simple shell script we copied before logging in:
[ec2-user@ip-10-0-0-201 data] $ nano submit.sh
23.
Enter the text below at the end of the file (be sure to replace the TopicArn number):
cp /data/manual_entry.txt /data/manual_entry2.txt

aws sns publish --topic-arn arn:aws:sns:ap-southeast-1:xxxxxx:awsnotify --message "JobDone"
Exit and save the file.
24.
Submit the job and check the status:
[ec2-user@ip-10-0-0-201 data] $ sbatch submit.sh

[ec2-user@ip-10-0-0-201 data] $ squeue
Something like this means the job is still waiting to be run:
PD: PendingCF: Configuring
JOBID  PARTITION      NAME       USER  ST       TIME  NODES  NODELIST(REASON)
    2    compute  example-   ec2-user  CF       0:05      1  compute-dy-t2micro-1
You should then receive a SNS notification from your EC2 CloudWatch rule once the compute node gets set up, but it might still take some time before the job will start running.
Something like this means the job is running:
R: Running
JOBID  PARTITION      NAME      USER  ST       TIME  NODES  NODELIST(REASON)
    2    compute  example-  ec2-user   R       0:05      1  compute-dy-t2micro-1
25.
Once the job disappears from the queue (or if you receive the email saying that the job is done), you can check the output. If you list the files in the /data directory, you should see:
lost+found         miniconda3  slurm.compute-dy-t2micro-1.2.err
manual_entry2.txt  picasso     slurm.compute-dy-t2micro-1.2.out
manual_entry.txt   RCP         submit.sh
You can do the following to check the output contained in the file slurm.compute-dy-t2micro-1.2.out and errors in the file slurm.compute-dy-t2micro-1.2.err from the job:
[ec2-user@ip-10-0-0-201 data] $ cat slurm*
which should just show you the output of the aws sns publish command if everything went well:
{
    "MessageId": "89229119-cbbf-5450-be6b-c8a7cb8300a9"
}
Task
Take a screenshot of your Terminal window showing the directory listing of all the files above and include it in your lab report.
Task
Take a screenshot of the notification email from AWS saying the job is done and include it in your lab report.
26.
Before we exit the cluster, we will copy the ~/.aws directory which contains the AWS keys to /data so that it will be backed up for future use:
[ec2-user@ip-10-0-0-201 data] $ cp -r ~/.aws /data/aws
27.
Exit the cluster (you can also type Ctrl-d):
[ec2-user@ip-10-0-0-201 data] $ exit
Part 4. Shut down your cluster
28.
Since you have modified some of the files in the /data directory, you will want to save a new snapshot of the /data directory so you can continue from where you left off the next time you create a new cluster. You can do this by running the update_snapshot.sh script from a Terminal window on your computer (replace ~/Documents/EE3801/PyHipp with the path to your PyHipp repository):
Note
Windows users: Before running the command below, you will need to convert the Windows DOS format into unix format by doing:
$ dos2unix ~/Documents/EE3801/PyHipp/update_snapshot.sh
(aws) $ chmod a+x ~/Documents/EE3801/PyHipp/update_snapshot.sh

(aws) $ ~/Documents/EE3801/PyHipp/update_snapshot.sh data 2 MyCluster01
The first command will make the script executable while the second command will start the process of creating the snapshot.
The first augment is the name of the snapshot data, the second number 2 specifies how many similarly named snapshots to keep, while the last argument MyCluster1 specifies the name of the cluster you want to base the snapshot on.
Keep in mind that each snapshot you keep will use up some of your AWS credits. This command might take a while, so you can return once you receive the email notification.
29.
Check that the snapshot was created properly using the following command:
(aws) $ aws ec2 describe-snapshots --owner-ids self --query 'Snapshots[]'
You should see something like the following:
[
    {
        "Description": "data",
        "Encrypted": false,
        "OwnerId": "xxxxxxxxxxxx",
        "Progress": "100%",
        "SnapshotId": "snap-xxxx",
        "StartTime": "2020-11-04T11:10:40.838Z",
        "State": "completed",
        "VolumeId": "vol-xxxx",
        "VolumeSize": 1000
    },
]
30.
You can add the update_snapshot.sh script to your shell’s path by adding the following line to your shell’s config file (substitute in the path to your PyHipp directory):
export PATH="/Users/your-user-name/Documents/EE3801/PyHipp:$PATH"
Note
In case you are not so sure what is your full path, cd to where your PyHipp is at and do:
$ pwd
31.
Once you have received the email notifying you that the snapshot has been completed, you can delete the cluster:
(aws) $ pcluster delete-cluster -n MyCluster01
Check that you have no clusters running:
(aws) $ pcluster list-clusters
This should return an empty list. If it does not, you will have to retry your cluster deletion command.
32.
In the future, you will just need to do the following to create a cluster, wait till you receive the notification that the head node is running, and then ssh to the head node:
(aws) $ pcluster create-cluster -c ~/cluster-config.yaml -n MyCluster01

(aws) $ pcluster ssh -i ~/MyKeyPair.pem -n MyCluster01
When you are done, you can do the following to create a snapshot, wait till you receive the notification that the snapshot has been completed, and then delete the cluster:
(aws) $ update_snapshot.sh data 2 MyCluster01

(aws) $ pcluster delete-cluster -n MyCluster01
Part 5. Track your AWS usage
33.
In order to track your AWS usage, go to the following link.
34.
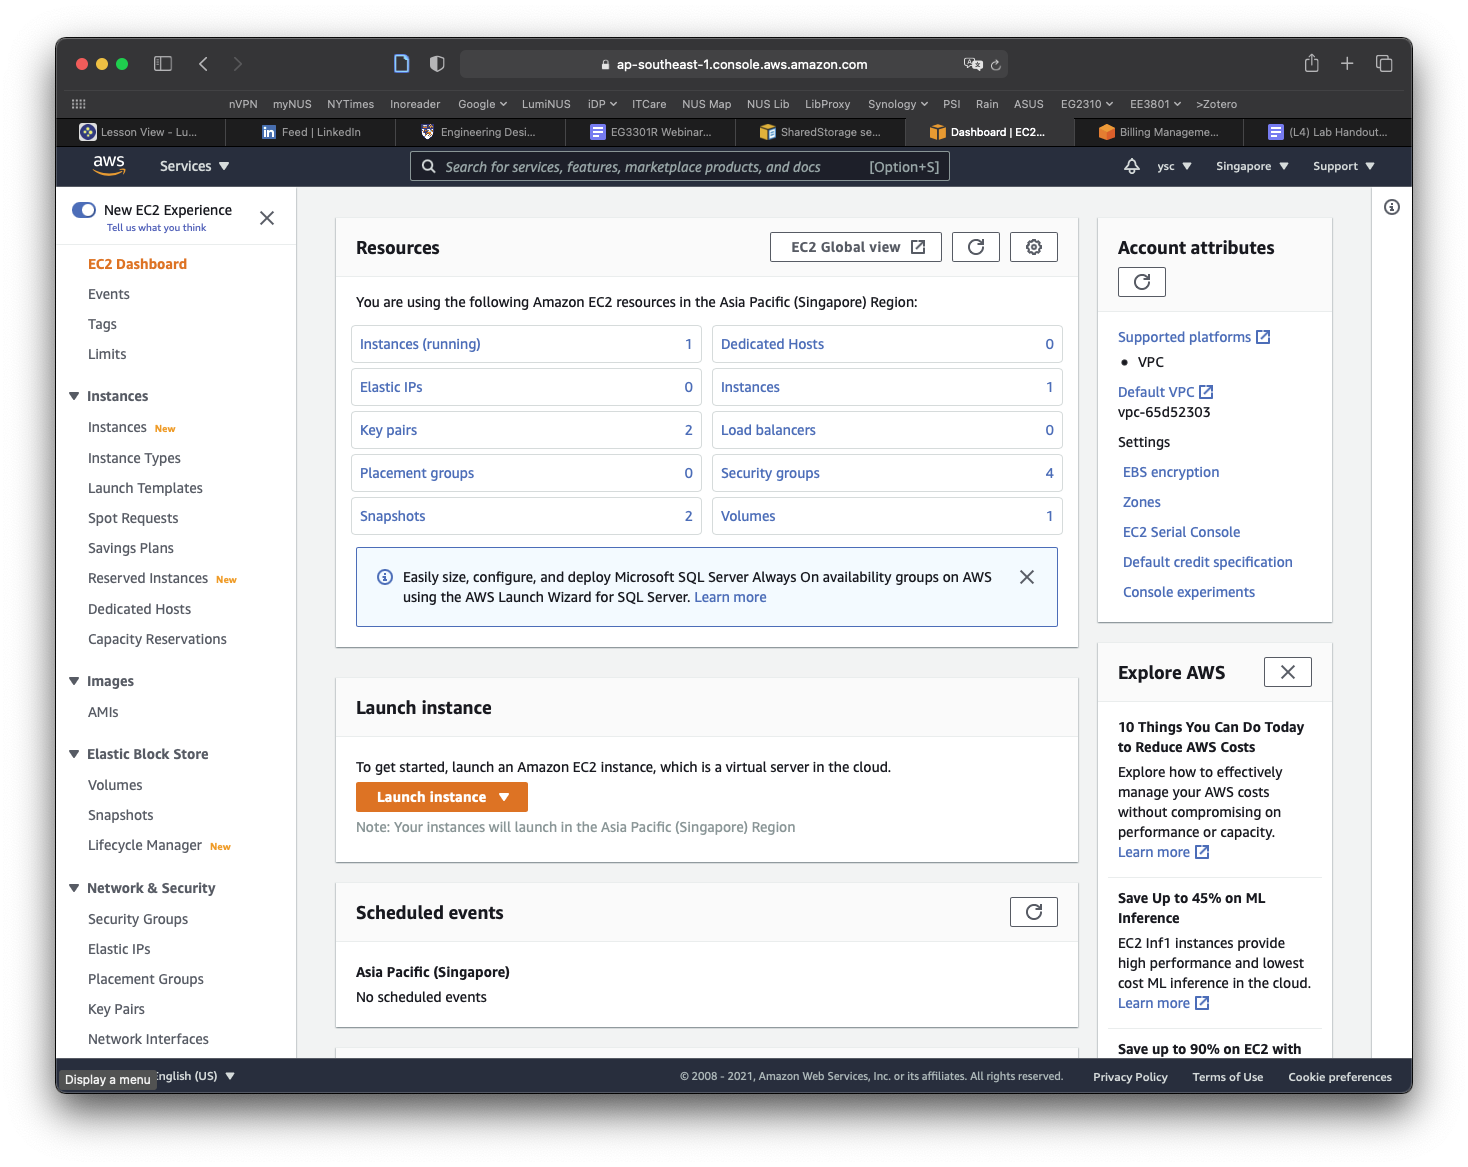
First, click the “Services” drop-down menu in the top left, and then click “EC2”:
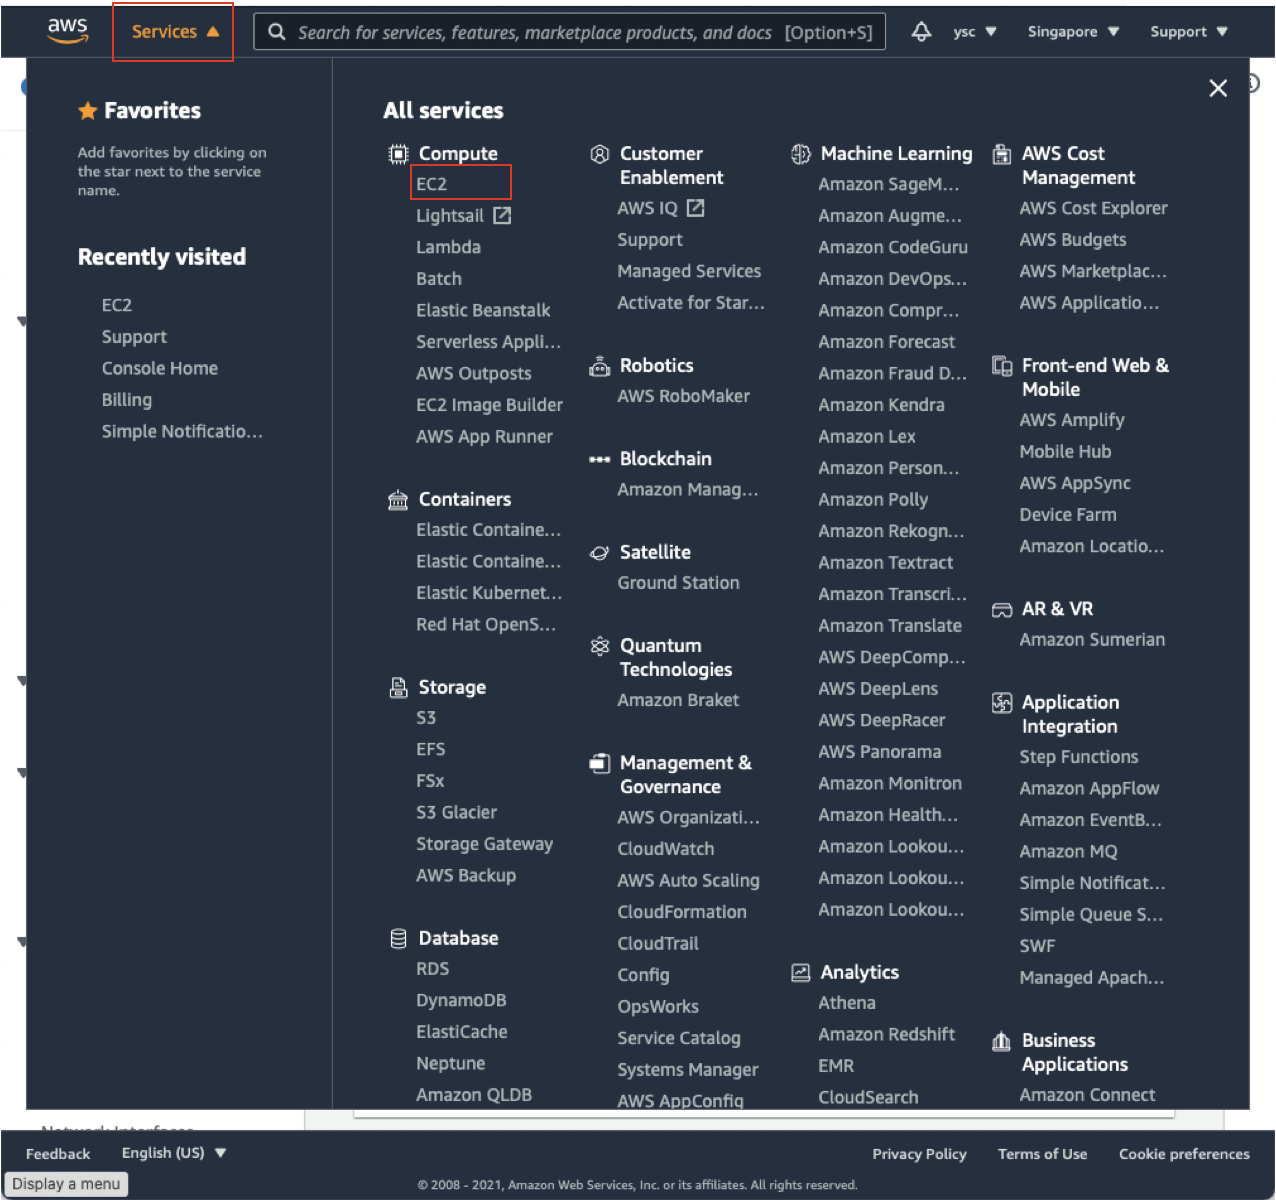
This will take you to your EC2 Dashboard:
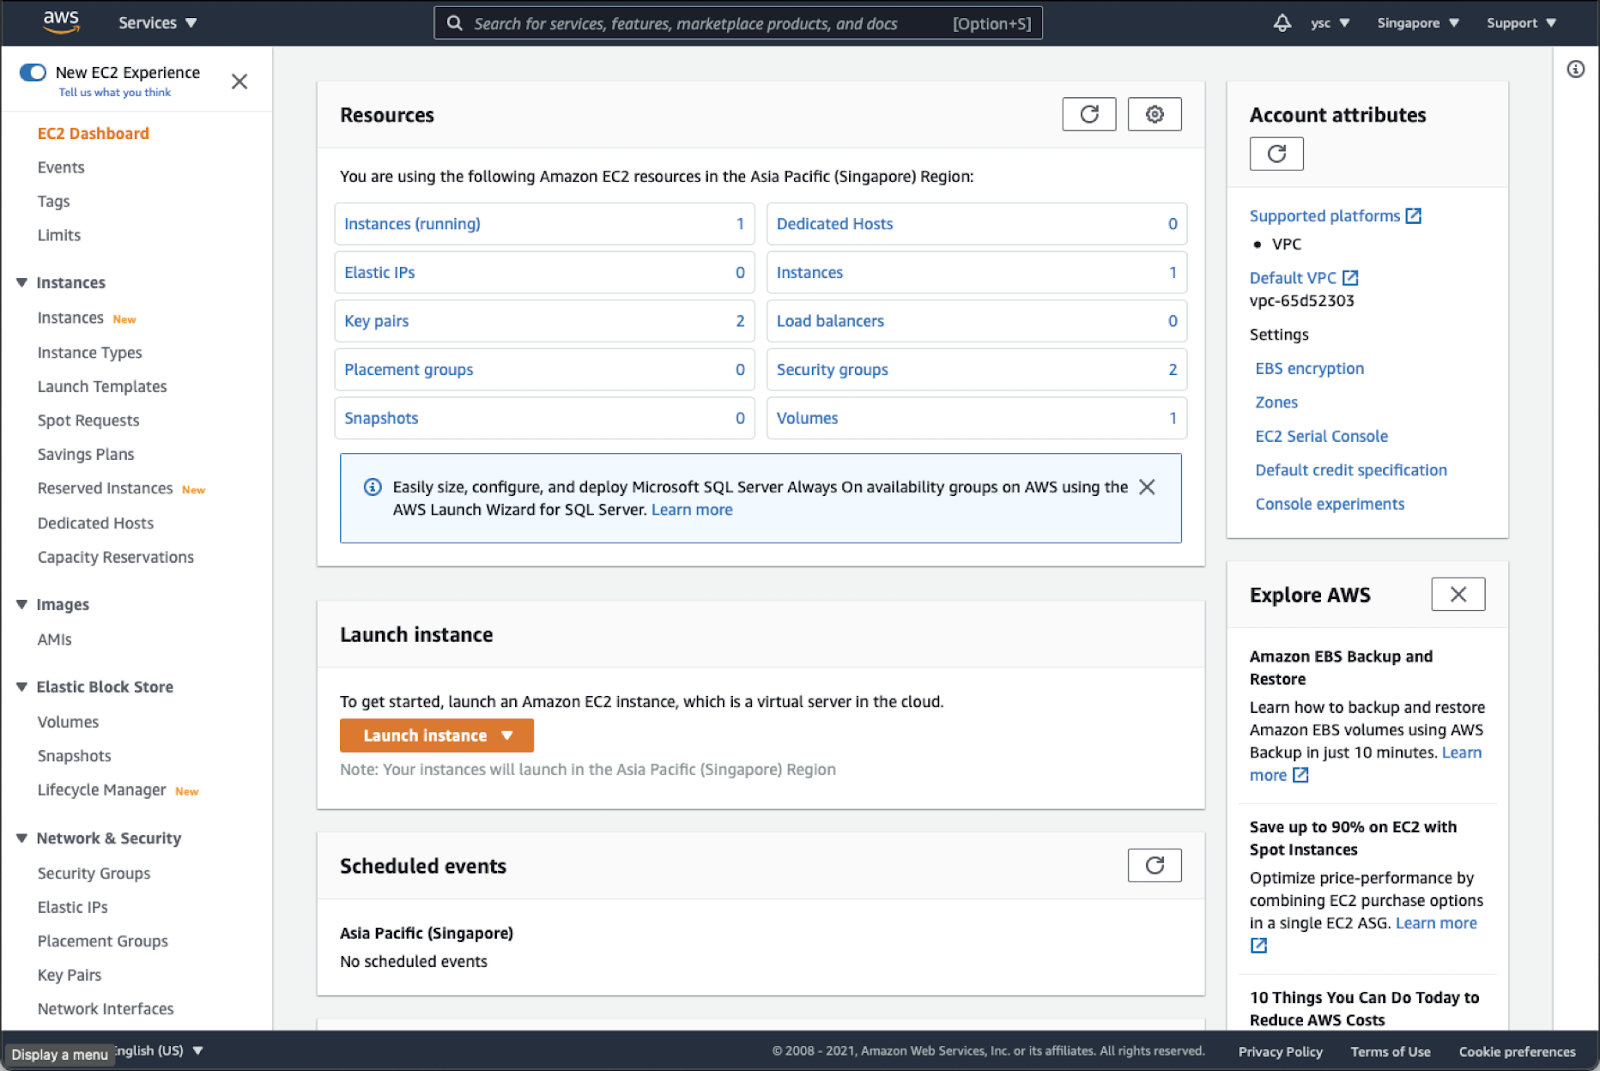
Check “Instances (running)”, and make sure that you do not have any instances running. If you do, you might have forgotten to delete a cluster, so you should run the following command from the Terminal:
(aws) $ pcluster list-clusters
Followed by (replace MyCluster01 below with the name of any clusters you see listed above):
(aws) $ pcluster delete-cluster -n MyCluster01
Task
Once you have made sure that you do not have any running instances, take a screenshot of your EC2 dashboard, and include it in your lab report.
Warning
Please remember to do this for all subsequent labs. This is to ensure that you do not have any running instance that could potentially cost you a lot of money.
35.
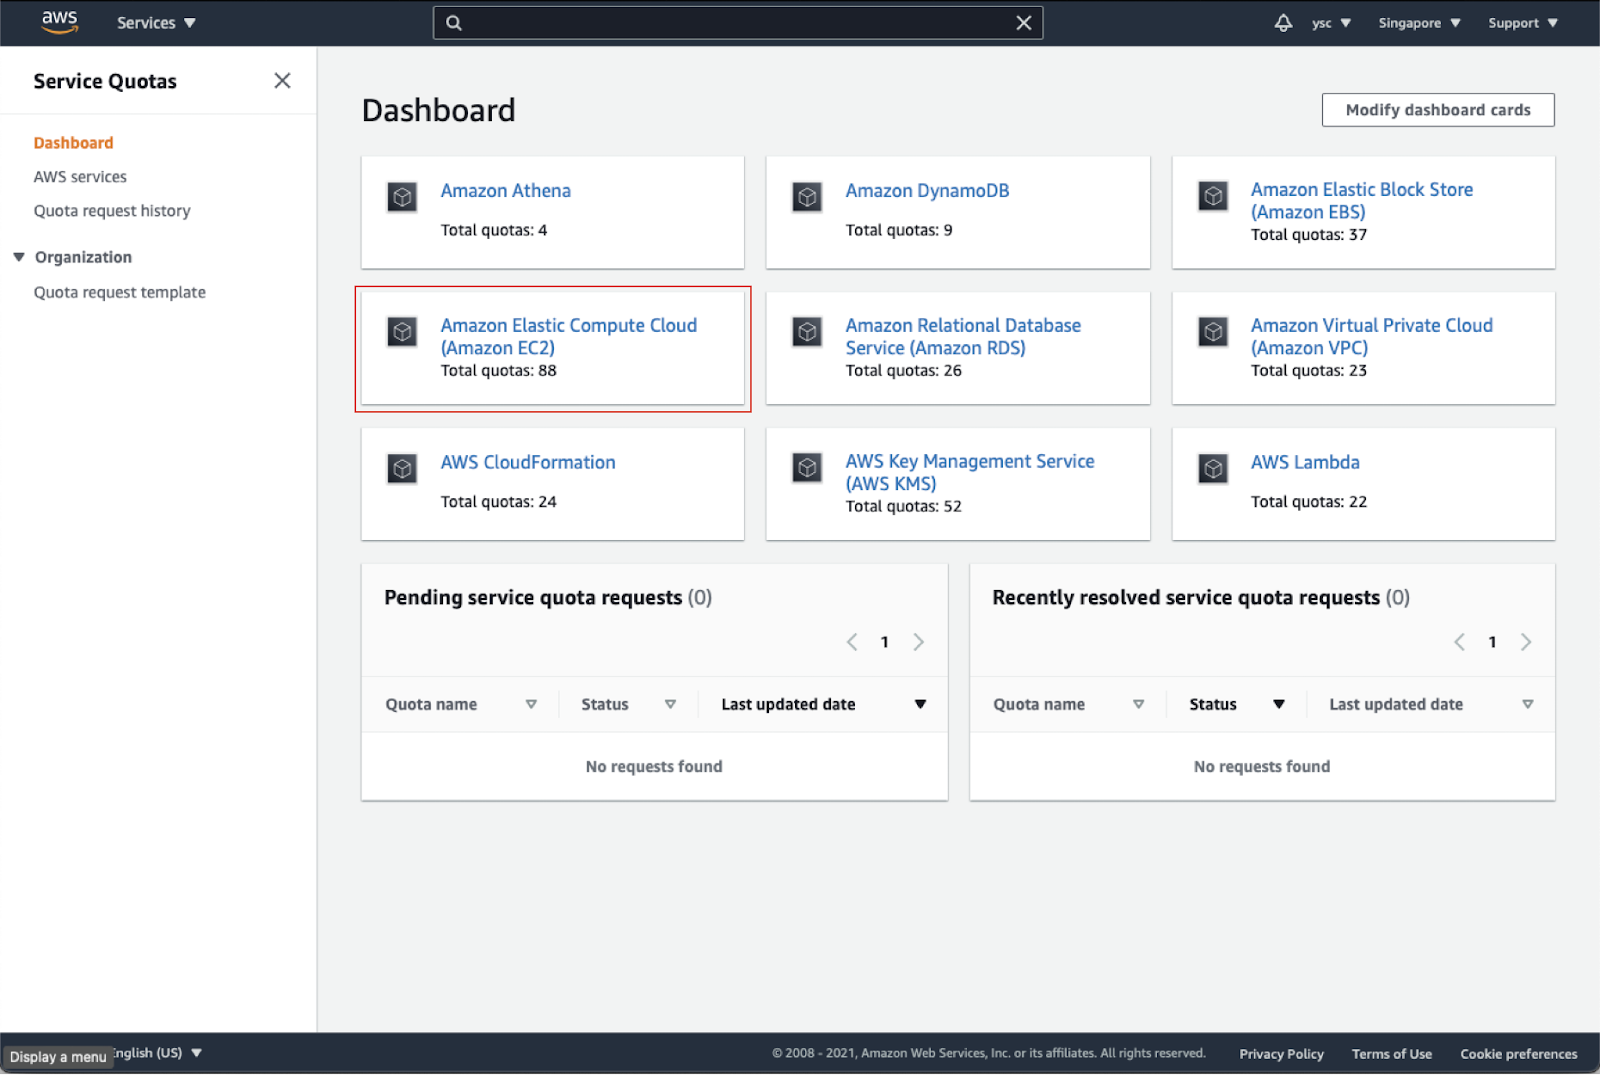
While you are at your EC2 Dashboard, check your virtual cpu limits by typing “Service quotas” in the top search bar and click on the “Service Quotas” service that appears:

Click on “Amazon Elastic Compute Cloud (Amazon EC2)” in the dashboard:
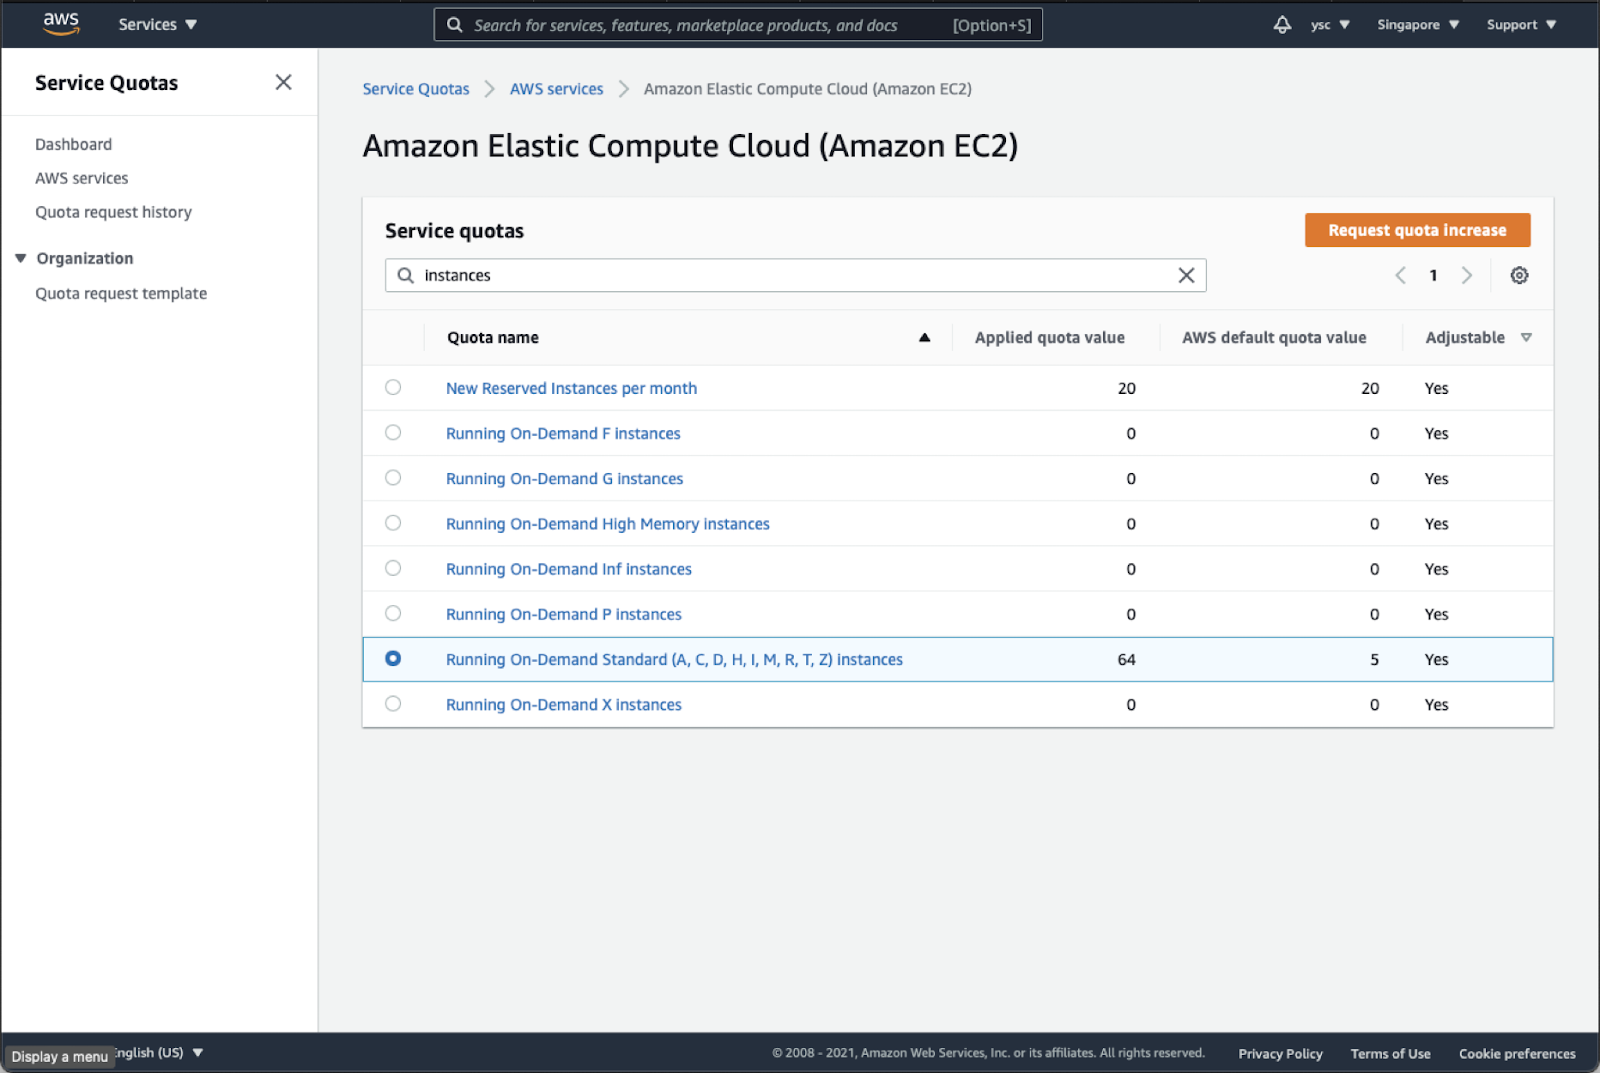
Type “instances” in the search bar, and check your Applied quota value for Running On-Demand Standard (A, C, D, H, I, M, R, T, Z) instances. If your limit is not 64, select that option, and click the Request quota increase button in orange in the top right:
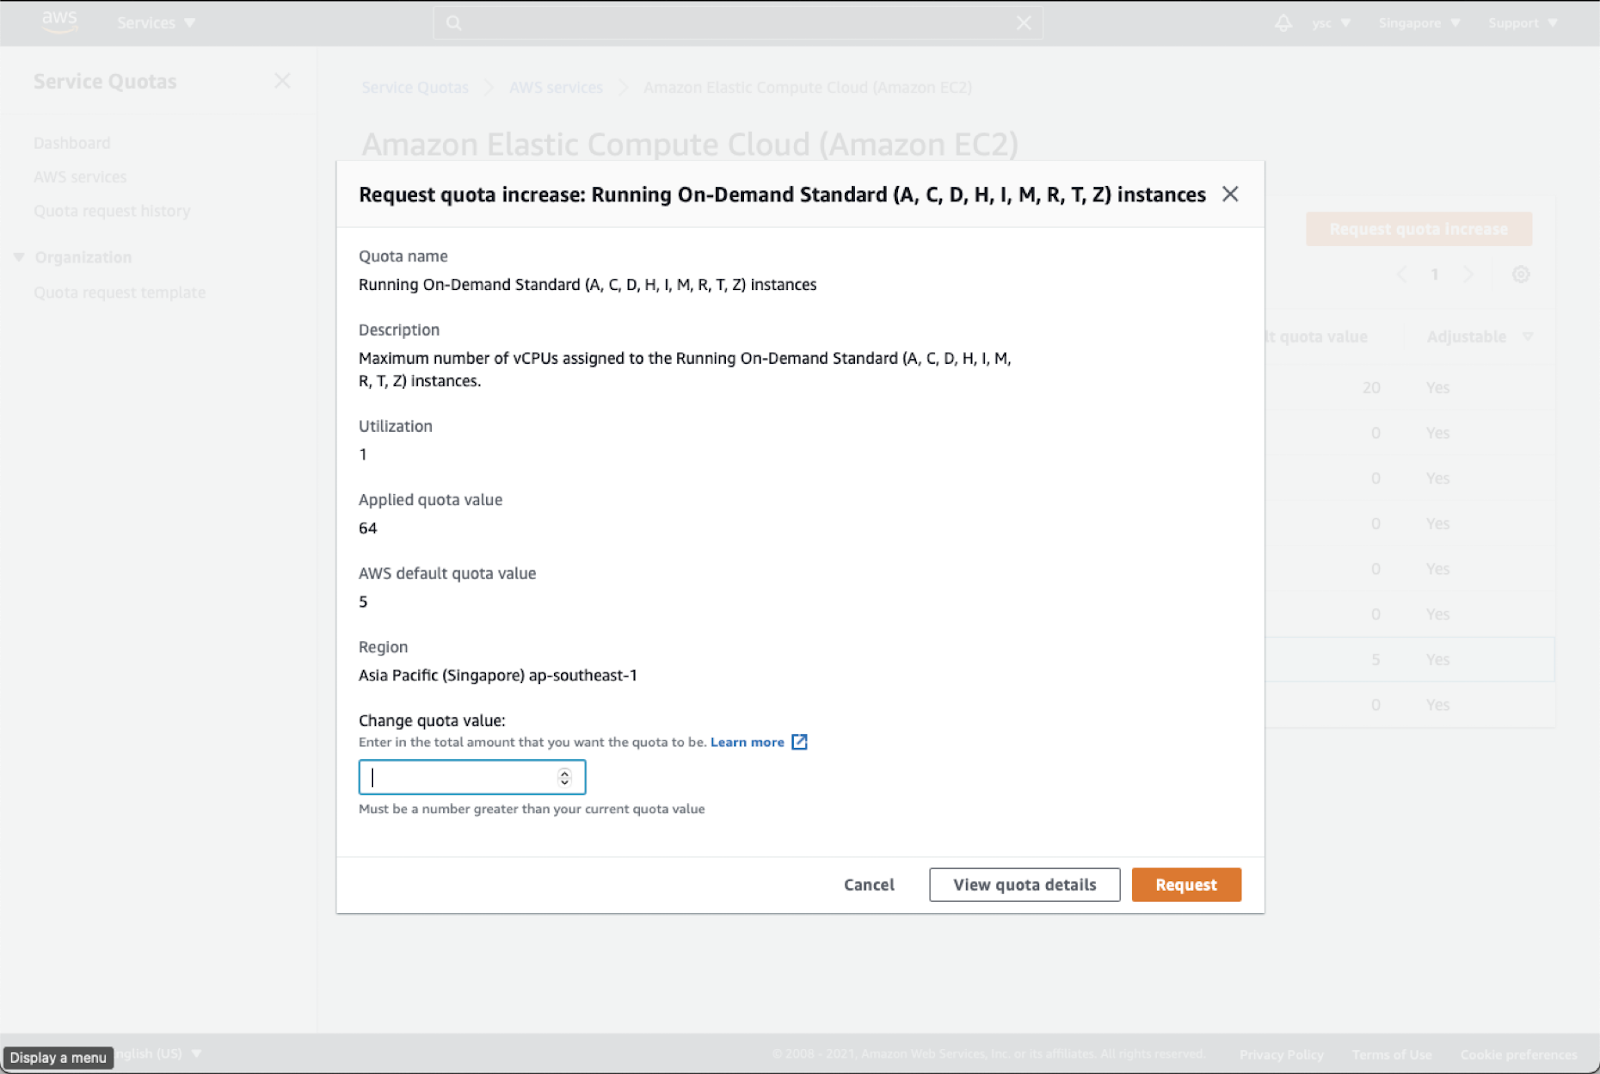
Enter 64 in the Change quota value text box, and then click the Request button in the bottom right:
36.
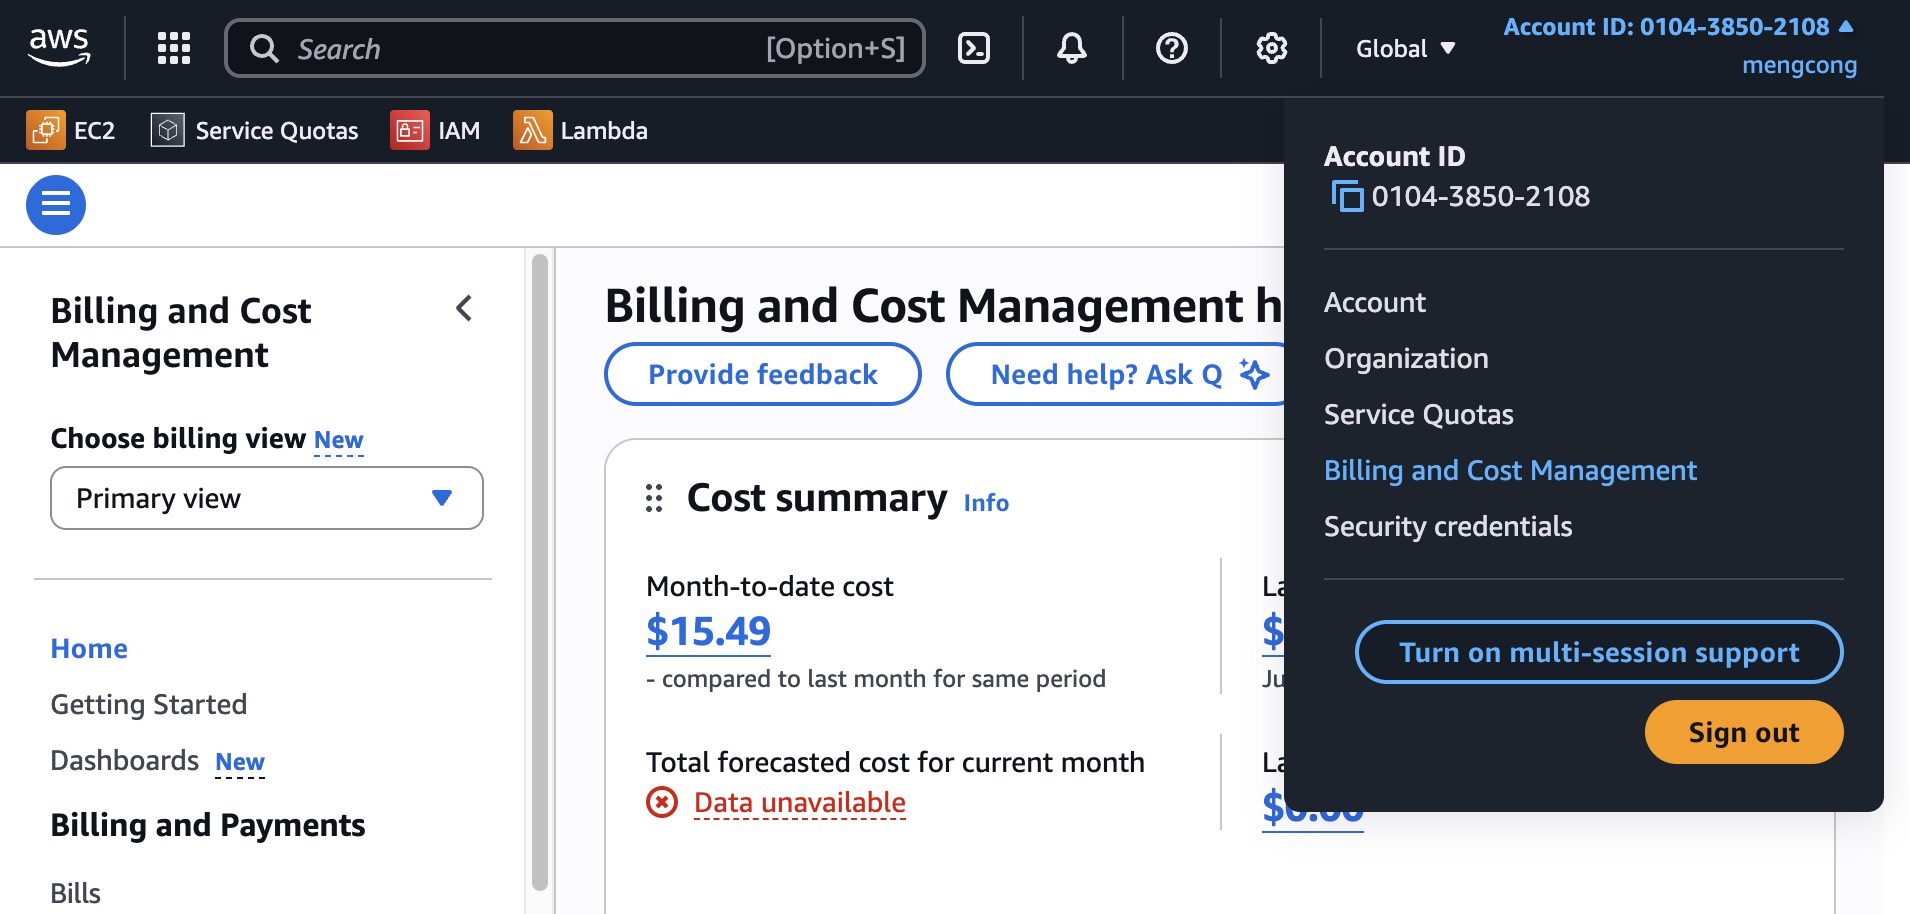
Next, find the link to “My Billing Dashboard”:
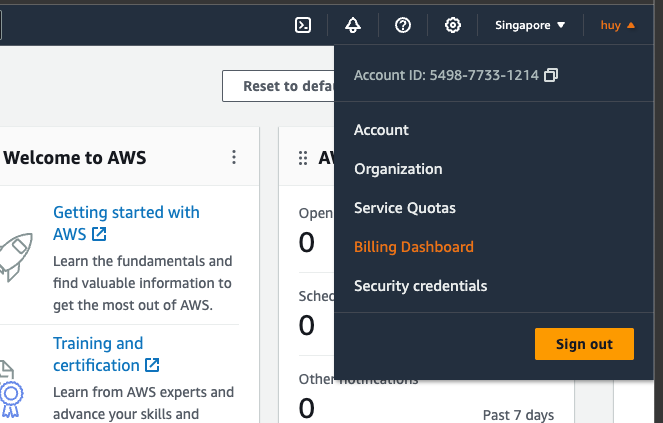
Click the Bills option from Billing drop down:
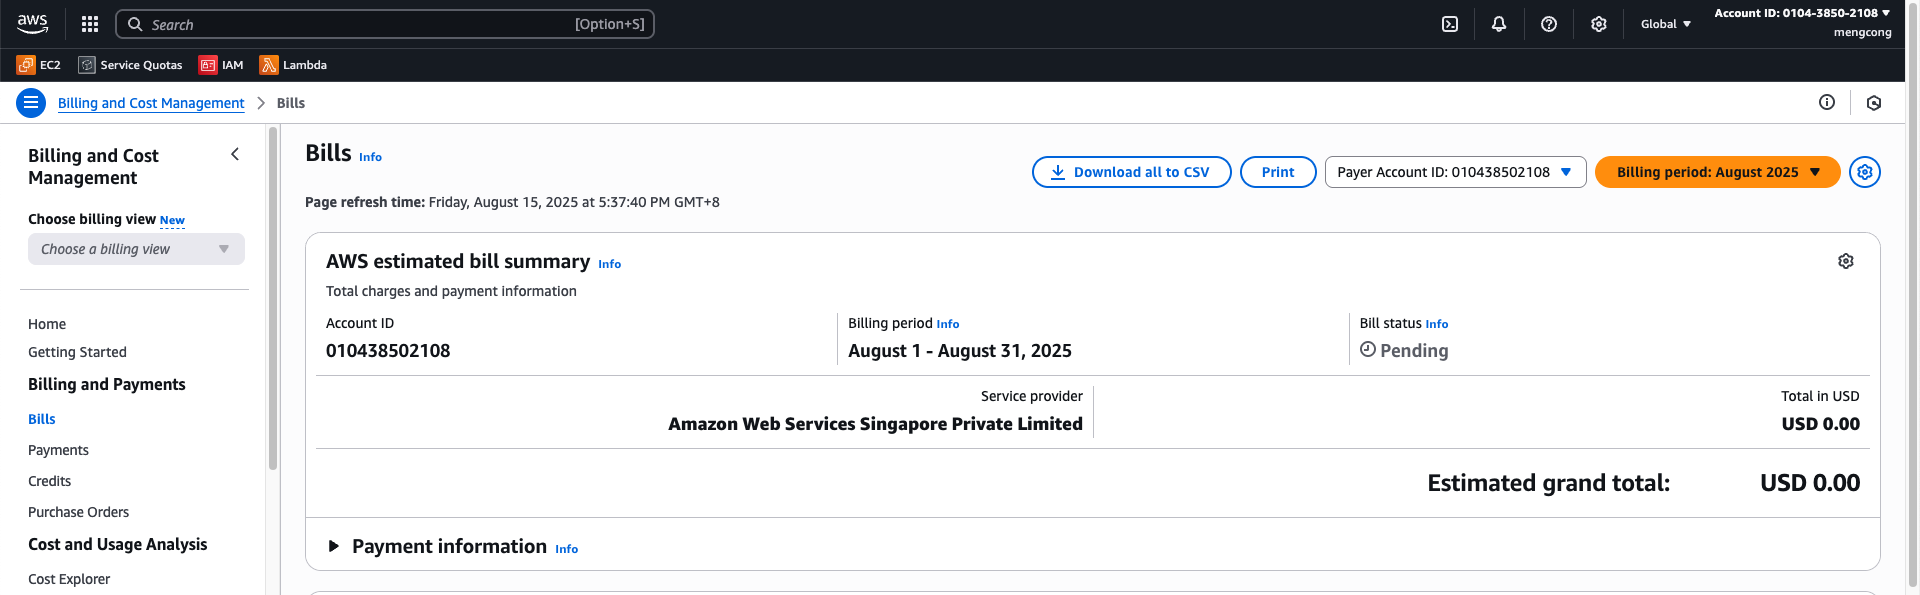
In the drop-down menu for “Billing Period”, select the current month:
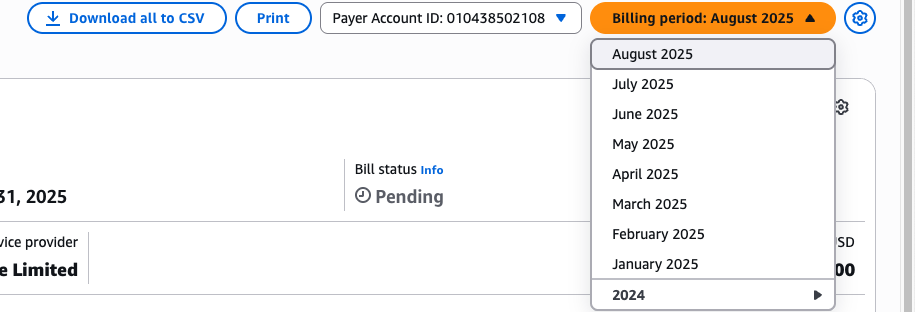
This will list the charges you have incurred.
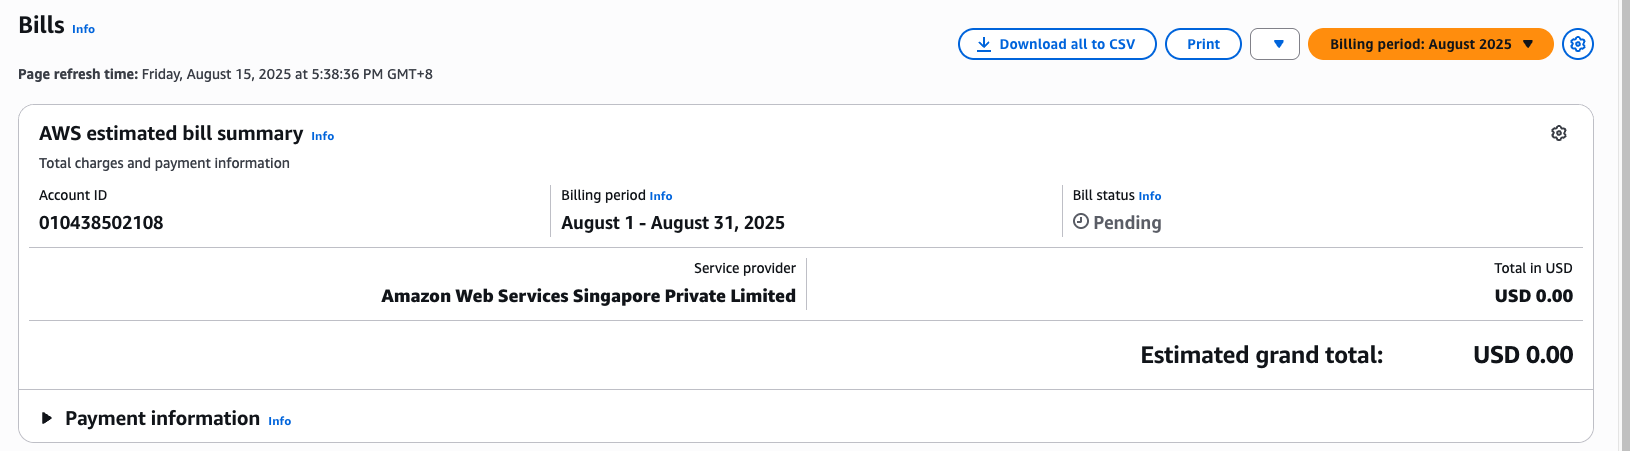
Task
Take a screenshot of the screen above to show the charges and include it in your lab report. It is fine if there are no charges listed yet.
Warning
Please remember to do this for all subsequent labs. This is to ensure that your bill is within expectation.
37.
In order to avoid being surprised by unexpected charges, you can use AWS Budgets to warn you when your credits are running low. First navigate to the Cost Explorer options under Cost Management
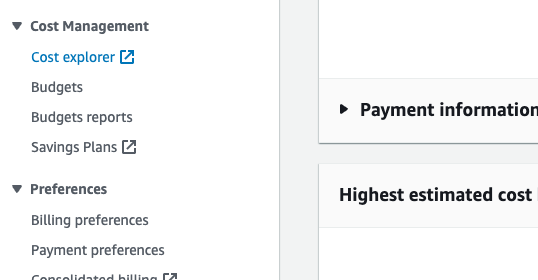
It will open up a new tab and you should see the following:
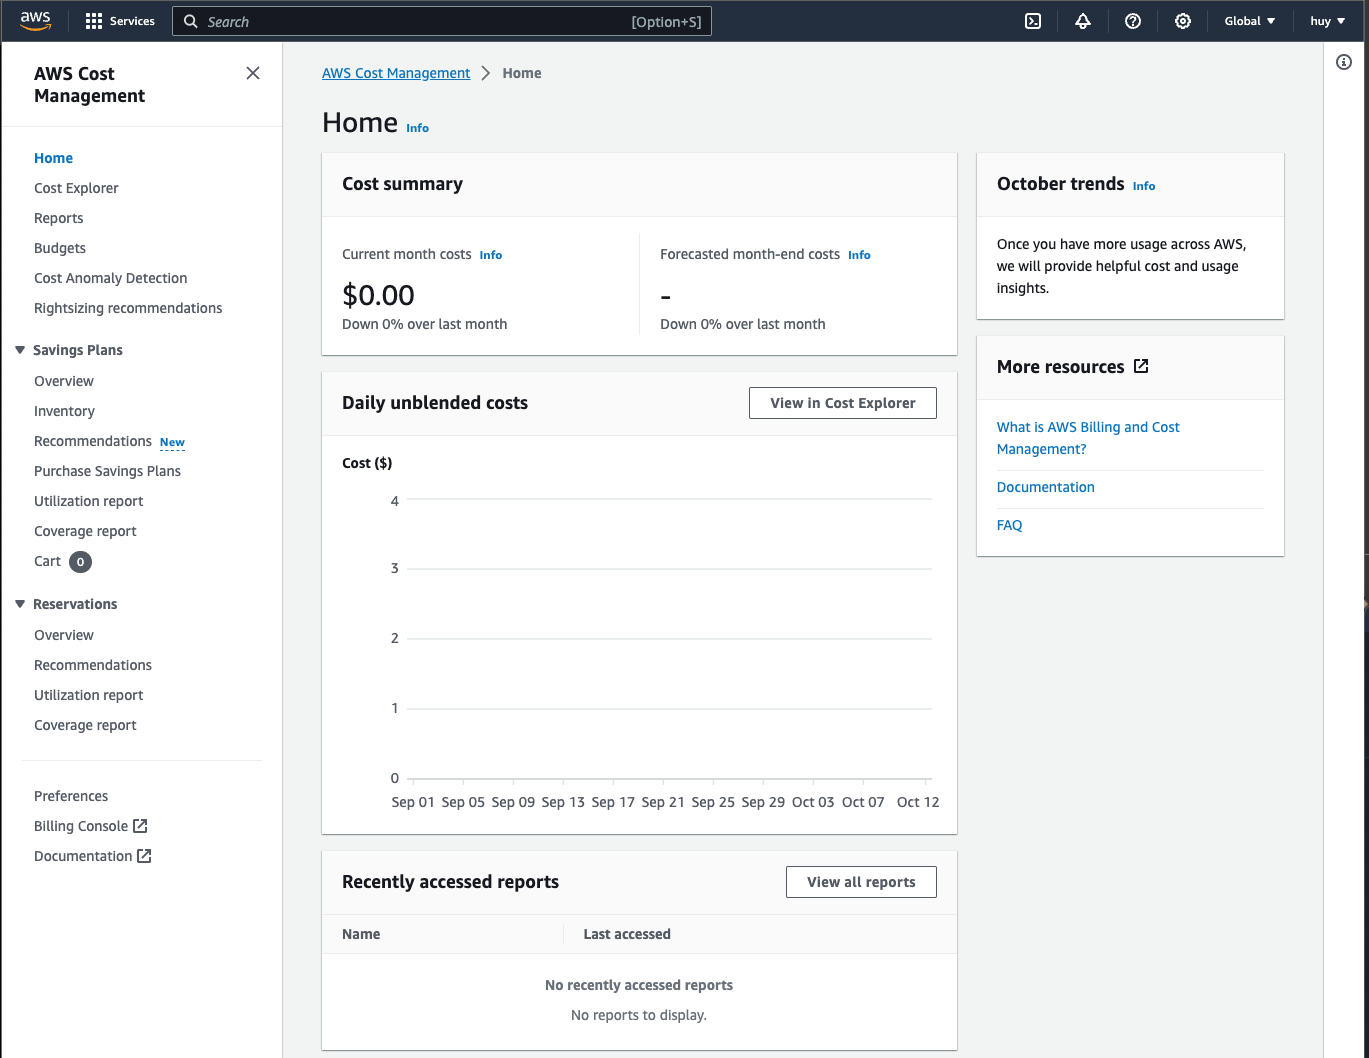
You should be able to see your current month costs. This will usually from our experience by updated more frequently than your billing view, so we also need to check this after every lab.
Task
Take a screenshot of the screen above to show the charges and include it in your lab report. It is fine if there are no charges listed yet.
Warning
Please remember to do this for all subsequent labs. This is to ensure that your bill is within expectation.
38.
Remember to always check for your budgets from this lab onward, as it will tell you if you have accidentally incur an exhorbitant cost to your services that could cause you an arm and a leg. In the next section, we will set up a budget which will allow us to receive email or notification before we exceed our cost, which will help us manage our budget better.
Part B
This part will consist of:
- Familiarize yourself with the command line (Estimated time: 15 mins) [OPTIONAL]
- Installing and testing software on AWS (Estimated time: 60 mins)
- Setting up the data pipeline (Estimated time: 10 mins)
- Executing the data pipeline (Estimated time: 20 mins)
- Checking the output (Estimated time: 15 mins)
- Wrapping up (Estimated time: 10 mins)
Task
Submit the following task for lab report for Part A:
before:
9 pm on August 27th (Wednesday)
in PDF format only to the Lab 3B folder, and name the file
Lab3B_YourName.pdf
Part 6. Familiarize yourself with the command line [OPTIONAL]
39.
Note
This section is totally OPTIONAL and WILL NOT BE GRADED. It is meant to give you more practice in using the command line to navigate around and reading the content of your folder and files. It might be helpful to you in later lab.
You will be using the bash command line throughout the remaining labs, so familiarize yourself with the bash command line on your computer by reading through Section 1 (i.e. 1.1, 1.2, and 1.3) of this cheatsheet before answering the questions.
- Change directory to your home directory from any other directory
- List the files and directories in the current directory
- List all files and directories including hidden files and directories with
.in the filename, e.g..bash_profile - List all items (excluding hidden items) in the current directory with file sizes
- Show the manual for the
lscommand - List all items (excluding hidden items) in the current directory with file sizes sorted by their modification time
- Change directory to the
Documentssubdirectory - Return the full path for the current directory
- Create a new subdirectory named
ee3801 - Change directory to the parent directory from the
Documentsdirectory - Change directory to the
ee3801subdirectory you created earlier in one command - Create a file named
test.txtfrom the command line (i.e. without using an editor) - Change directory back to your previous directory in one command
- Remove the
ee3801subdirectory you created and all its contents - Display the entire shell config file (e.g.
.bash_profile/.bashrc/.zshrc) in your home directory - Display the shell config file part-by-part
- Display the first 10 lines of the shell config file
- Display the last 10 lines of the shell config file
- Copy the shell config file to a file named
.bashrc-orig - Rename the
.bashrc-origfile to.obashrc - Remove the
.obashrcfile - Display a count of only the number of lines in the shell config file
- Look for the word
condain the shell config file - Show how much disk space you have available in human readable form (i.e. kilobytes, megabytes, gigabytes, etc.)
- Show the cumulative disk usage of all the items in your
~/Documentsdirectory in human readable form (if your Documents directory is empty, use another directory that has multiple files like~/miniconda3) - Show the current date and time
Part 7. Installing and testing software on AWS
40.
First, we will create a Terminal window, activate your aws conda environment, and edit the config file to modify the instance type for the head and compute nodes (Windows users please be sure to do everything in the WSL environment):
(base) $ conda activate aws

(aws) $ nano ~/cluster-config.yaml
Note
Your operating system cli usually ship with a few text editor. One of the is
nano. Another famouse one that you will have probably heard of isvim.vimis much more powerful, but also has a higher learning curve thannano. Bothvimandnanoare shifted with MacOS, Linux and Window WSL. You are welcome to useviminstead ofnanofor the rest of this course.
Modify the following in the “HeadNode” section:
HeadNode:
  InstanceType: t3a.nano
In order to spread out the load, use the following table to find out the instance type you should use according to the last number before the letter in your student number (e.g. use the number 4 if your student number is A0171234X):
Head Node
| Last Digit | Type | Last Digit | Type | Last Digit | Type |
|---|---|---|---|---|---|
| 0 | t3a.large | 4 | m5.large | 8 | m5d.large |
| 1 | t3.large | 5 | m6i.large | 9 | m5n.large |
| 2 | m5a.large | 6 | m4.large | ||
| 3 | t2.large | 7 | m5ad.large |
and the table below to fill in the “Name” and “InstanceType” in the Scheduling section (replace the . in InstanceType with - when entering the Name):
Scheduling:
  Scheduler: slurm
  SlurmQueues:
  - Name: queue1
    ComputeResources:
    - Name: t3a-nano
      InstanceType: t3a.nano
Compute Node
| Last Digit | Type | Last Digit | Type | Last Digit | Type |
|---|---|---|---|---|---|
| 0 | m5.4xlarge | 4 | r5n.2xlarge | 8 | r5.2xlarge |
| 1 | z1d.2xlarge | 5 | r5b.2xlarge | 9 | r5a.2xlarge |
| 2 | m5a.4xlarge | 6 | r5d.2xlarge | ||
| 3 | r5dn.2xlarge | 7 | r5ad.2xlarge |
You can find more about different instance types at:
In order to use pcluster, one of the limitations is that the head node and the compute nodes are required to have the same architecture. In order to keep things simple, we will be using “x86_64” architecture for both the head and compute nodes.
The head node is just used to submit jobs and handle file system requests, so we will usually find a relatively cheap instance type with the same architecture and 8 GB of memory (in order to handle the file system requests), which includes t3a.large, t3.large, m5a.large, etc. (see the description of the instance types in the first link above, and the prices in the second link, where you can scroll to the right of the table, and click on the “On-Demand Linux pricing” to sort by price). Avoid instance types that have their architecture listed as “i386, x86_64” as they are often incompatible with computer nodes that have architecture listed as “x86_64”.
For the compute nodes, we recommend instance types with a minimum of 64 GB of memory. This will allow us to have enough memory to read in and split the .ns5 neural data files, which are around 40 GB in size. Due to the AWS limit of 64 vCPUs per user, if you use an instance with a large number of vCPUs, e.g. m6g.12xlarge, which has 48 vCPUs, you will only be able to create 1 compute node with 48 vCPUs as creating 2 compute nodes will require 96 vCPUs, which will exceed your vCPU limit. On the other hand, if you use instance types with 8 vCPUs, you will be able to create 8 instances for a total of 64 vCPUs. So, choosing the right instance types will allow you to have more vCPUs available for your jobs.
Finally, make sure MountDir is set to data and replace SnapshotId in the config file with the ID of the last snapshot named data in your AWS EC2 Snapshots Dashboard:
SharedStorage:
  - MountDir: data
    Name: ee3801
    StorageType: Ebs
    EbsSettings:
      Size: 1000
      Encrypted: false
      SnapshotId: snap-xxxxxxxxxxxxxxxxx
41.
Next, we will do a one-time set up of your environment on AWS ParallelCluster. We will start by creating a cluster on AWS (enter the command below all on the same line):
(aws) $ pcluster create-cluster -c ~/cluster-config.yaml -n MyCluster01
If you get an error like:
Beginning cluster creation for cluster: MyCluster01
Creating stack named: parallelcluster-MyCluster01
Status: parallelcluster-MyCluster01 - ROLLBACK_IN_PROGRESS
Cluster creation failed.  Failed events:
  - AWS::CloudFormation::WaitCondition MasterServerWaitCondition Received FAILURE signal with UniqueId i-0e06294577f6606d0
You might need to delete the cluster first by doing:
(aws) $ pcluster list-clusters

MyCluster01  ROLLBACK_COMPLETE 2.9.1

(aws) $ pcluster delete-cluster -n MyCluster01
You can then try re-creating the cluster using a different head node.
42.
Once you receive the notification email stating that your head node is running, login to the cluster:
(aws) $ pcluster ssh -i ~/MyKeyPair.pem -n MyCluster01
43.
Change to the directory where the snapshot you saved in Part A is mounted:
[ec2-user@ip-10-0-5-43 ~] $ cd /data
If you receive an error like:
-bash: cd: /data: No such file or directory
You might have to wait a couple of minutes for AWS to mount your /data volume before trying again.
44.
Miniconda has already been installed for you, along with an environment called env1. So you can initialize your conda environment by doing:
[ec2-user@ip-10-0-5-43 data] $ miniconda3/bin/conda init
This will add some commands to your ~/.bashrc, so you can reload it to get the conda commands to work:
[ec2-user@ip-10-0-5-43 data] $ source ~/.bashrc

(base) [ec2-user@ip-10-0-5-43 data] $ conda activate env1

(env1) [ec2-user@ip-10-0-5-43 data] $
Your prompt should now be prefixed by (env1) instead of (base).
You should also copy the /data/aws directory back to ~/.aws:
(env1) [ec2-user@ip-10-0-5-43 data] $ cp -r /data/aws ~/.aws
Check that your aws credentials are working properly by sending yourself a notification email (remember to replace the numbers in the topic-arn with your account number):
(env1) [ec2-user@ip-10-0-5-43 data] $ aws sns publish --topic-arn arn:aws:sns:ap-southeast-1:xxxxxx:awsnotify --message "ClusterTest"
45.
We will now clone the GitHub repository (replace the username for the PyHipp repository with your username):
(env1) [ec2-user@ip-10-0-5-43 x64] $ cd /data/src

(env1) [ec2-user@ip-10-0-5-43 src] $ git clone https://github.com/your_user_name/PyHipp
If you list the files and directories in the "src" directory, you will see that the DataProcessingTools and pyedfread packages are already installed.
46.
We will install the PyHipp module using pip:
(env1) [ec2-user@ip-10-0-5-43 src] $ cd PyHipp

(env1) [ec2-user@ip-10-0-5-43 PyHipp] $ pip install -r requirements.txt

(env1) [ec2-user@ip-10-0-5-43 PyHipp] $ pip install -e .

(env1) [ec2-user@ip-10-0-5-43 pyedfread] $ cd /data
47.
In order to try processing the data, we will want to run on one of the compute nodes as it has at least 64 GB of memory. So do the following to login to a compute node:
(env1) [ec2-user@ip-10-0-5-43 data] $ srun --pty /bin/bash
If you get an error saying that the srun command is not found, you may have to log out and log back in. This is usually due to some network volumes not being mounted yet after the creation of the cluster.
It will take a little time for the compute node to be started up, after which you should receive an email. Your prompt should also change to something like (the portion after queue1-dy- should correspond to the instance type you have specified in your cluster config file):
(base) [ec2-user@queue1-dy-m54xlarge-1 ~] $
Activate the env1 conda environment as usual, and change to the /data directory:
(base) [ec2-user@queue1-dy-m54xlarge-1 ~] $ conda activate env1

(env1) [ec2-user@queue1-dy-m54xlarge-1 ~] $ cd /data
48.
We will now start up ipython (which is a little easier to use than regular python) to test that everything was installed properly:
(env1) [ec2-user@queue1-dy-m54xlarge-1 data] $ ipython

In [ ]: import PyHipp as pyh
In [ ]: pyh.pyhcheck('hello')
hello
In [ ]: from pyedfread import edf
In [ ]: cd src/pyedfread
In [ ]: samples, events, messages = edf.pread('SUB001.EDF')
In [ ]: events.shape
Out[ ]: (485, 30)
Note that the In [ ]: prompt indicates that the command should be entered in iPython.
49.
We will now go through and test the software that has been installed. We will start by processing the Ripple .nev files containing the signals sent by Unity via the parallel port. We will use a Python class named RPLParallel defined in the PyHipp repository to create a RPLParallel object:
In [ ]: cd /data/picasso/20181105/session01
In [ ]: pyh.RPLParallel(saveLevel=1)
which should give you the following:
Object created
Opening .nev file, creating new RPLParallel object...
Object saved to file rplparallel_d41d.hkl
Out[ ]: <PyHipp.rplparallel.RPLParallel at 0x7fb0fcaa2160>
The saveLevel=1 argument tells the function to save the RPLParallel object into the current directory after it has been created. It is a feature common to all the classes defined in the PyHipp repository.
We will do the same for the eye fixation session:
In [ ]: cd ../sessioneye
In [ ]: pyh.RPLParallel(saveLevel=1)
50.
The navigation session and the fixation session each contain a .ns5 file that contains the neural data from 110 channels. We can separate out one of the channels (Channel 9) by doing:
In [ ]: cd ../session01
In [ ]: pyh.RPLSplit(channel=[9])
which will return the following showing that a RPLRaw object for Channel 9 was created (as the .ns5 is pretty large, the entire process might take 10 to 15 minutes):
Object created
.ns5 file loaded.
Processing channel 009
Calling RPLRaw for channel 009
Object created
Object saved to file rplraw_d41d.hkl
Channel 009 processed
Out[ ]: <PyHipp.rplsplit.RPLSplit at 0x7f07b25a7828>
We do not need to specify the saveLevel=1 argument as the primary function of the function is to create the appropriate RPLRaw objects, which are then saved by default.
If you would like to be notified when the function is done, you can follow these instructions to use CloudWatch to set up an alarm to notify you when the Head Node’s Network Out Bytes falls below 1,000,000.
If you check the current directory by doing:
In [ ]: ls
you will see a directory named array01. If you check that directory and its subdirectory:
In [ ]: ls array01
In [ ]: ls array01/channel009
you will see a file named rplraw_d41d.hkl that contains the raw data just for Channel 9.
51.
In order to generate the low-pass filtered signals, we will call the RPLLFP function from the channel directory:
In [ ]: cd array01/channel009
In [ ]: pyh.RPLLFP(saveLevel=1)
which will load the RPLRaw object and create a RPLLFP object:
Object loaded from file rplraw_d41d.hkl
Object created
Applying low-pass filter with frequencies 1.0 and 150.0 Hz
Object saved to file rpllfp_6eca.hkl
Out[7]: <PyHipp.rpllfp.RPLLFP at 0x7f07b259f940>
52.
Similarly, to generate the high-pass filtered signals, we will call the RPLHighPass function:
In [ ]: pyh.RPLHighPass(saveLevel=1)
which will load the RPLRaw object and create a RPLHighPass object:
Object loaded from file rplraw_d41d.hkl
Object created
Applying high-pass filter with frequencies 500.0 and 7500.0 Hz
Object saved to file rplhighpass_b59f.hkl
Out[7]: <PyHipp.rplhighpass.RPLHighPass at 0x7f07b23ca400>
You can see the two new files created in the current directory by doing:
In [ ]: ls
which will give you:
rplhighpass_b59f.hkl rpllfp_6eca.hkl rplraw_d41d.hkl
53.
We can process the Unity files by doing:
In [ ]: cd ../../
In [ ]: pyh.Unity(saveLevel=1)
which will return:
Object created
Object loaded from file rplparallel_d41d.hkl
Object saved to file unity_71bf.hkl
Out[ ]: <PyHipp.unity.Unity at 0x7facccd89400>
You will see that in creating the Unity object, the previously saved RPLParallel object was loaded to extract some information. If the RPLParallel was not saved previously, the information in the object will have to be recomputed from the raw data files. This reduction in unnecessary recomputation was one of the principles on which the objects in the PyHipp repository were designed.
54.
This next command will process the eye-tracking files for both the navigation (180702.edf) and fixation (P7_2.edf) sessions, create eyelink objects, and save them to the session01 and sessioneye directories:
In [ ]: cd ..
In [ ]: pyh.EDFSplit()
which should return the following:
Reading calibration edf file.
Object created
Object saved to file eyelink_24d5.hkl
Reading navigation edf file.
...
Object saved to file eyelink_24d5.hkl
Object created
Out[ ]: <PyHipp.eyelink.EDFSplit at 0x7faccce0f1d0>
Similar to the RPLSplit function above, we do not need to specify the saveLevel=1 argument as the primary function of EDFSplit is to create and save the eyelink objects.
You might get a few “SerializedWarning” or “DataFrame” warning messages, but it is safe to ignore them.
55.
In order to align the Ripple, Unity, and Eyelink data, we will call the following function:
In [ ]: cd session01
In [ ]: pyh.aligning_objects()
which should end with the following (you can ignore the messages that precede it):
finish aligning objects
56.
For performing the raycasting, you can do:
In [ ]: pyh.raycast(1)
You should see some text ending with:
Object loaded from file unity_71bf.hkl
Object loaded from file eyelink_24d5.hkl
Found path: /data/RCP/VirtualMaze.x86_64
This might take about 20 minutes to complete, so we will instead just check that it started running properly before stopping it. Create a new Terminal window, activate the aws conda environment, and ssh to your cluster:
(base) $ conda activate aws

(aws) $ pcluster ssh -i ~/MyKeyPair.pem -n MyCluster01
Change to the directory from which you ran the raycast function:
(base) [ec2-user@ip-10-0-5-43 ~] $ cd /data/picasso/20181105/session01
The raycast function writes to a log file as it is running, so we can check the log file’s contents by doing:
(base) [ec2-user@ip-10-0-5-43 session01] $ tail -f VirtualMazeBatchLog.txt
You have used the tail function before to look at the last few lines of a file in this lab, but by adding the -f flag, it will now continuously show you the last few lines of the log file. This is one of the ways to monitor a program as it is running. The command above should progressively show you something like:
Add "-logfile <log file location>.txt" to see unity logs during the data generation
There may be a need to copy the libraries found in the directory 'Plugins' to a new folder called 'Mono'

More command line arguments can be found at https://docs.unity3d.com/Manual/CommandLineArguments.html
Session List detected!
Setting density to : 220
Setting radius to : 1
Queuing /data/picasso/20181105/session01
1 sessions to be processed
Starting(1/1): /data/picasso/20181105/session01
5.037168%: Data Generation is still running. 10/3/2021 2:45:51 AM
The last line above indicates that the program has started running, so everything should be installed properly. At this point, you can terminate the tail program by typing Ctrl-c. You can go back to your first Terminal window that was running ipython, and type Ctrl-c to interrupt the raycast function. You can then exit ipython by typing Ctrl-d.
If ipython does not respond, you can do the following from your second Terminal window:
(base) [ec2-user@ip-10-0-5-43 session01] $ ps -ef | grep ipython

ec2-user 12958  7414  0 13:37 pts/0    00:00:00 /data/miniconda3/envs/env1/bin/python /data/miniconda3/envs/env1/bin/ipython
ec2-user 13459 12716  0 13:43 pts/1    00:00:00 grep --color=auto ipython
The ps command lists running processes, which are then sent using the pipe command | to the grep command to search for the string ipython. The process ID for ipython (12958 in the example above) can be used to terminate the process by doing the following (replace the process ID below with the one you obtained from the command above):
(base) [ec2-user@ip-10-0-5-43 session01] $ kill -9 12958
If the ipython process was terminated properly, you should see the bash prompt in the first Terminal window again:
(env1) [ec2-user@queue1-dy-m54xlarge-1 data] $
You can then exit from the compute node by doing:
(env1) [ec2-user@queue1-dy-m54xlarge-1 data] $ exit
57.
From the second Terminal window, you can check that a few files have now been created in the session01 directory:
(base) [ec2-user@ip-10-0-5-43 session01] $ ls

181105_Block1.nev    eyelink_24d5.hkl s       slist.txt
181105_Block1.ns5    logs.txt                 unity_71bf.hkl
array01              missingData.csv          unityfile_eyelink.csv
binData.hdf          RawData_T1-400           VirtualMazeBatchLog.txt
rplparallel_d41d.hkl
Once you have verified the files have been created, you can type Ctrl-d to logout from the head node.
Task
Include a screenshot with the above output in your lab report.
58.
The last thing to do is to copy the following two files for spike sorting from the PyHipp directory to the /data directory using your first Terminal window (which should still be logged into your head node):
(env1) [ec2-user@ip-10-0-5-43 data] $ cp /data/src/PyHipp/geom.csv /data/picasso

(env1) [ec2-user@ip-10-0-5-43 data] $ cp /data/src/PyHipp/sort.sh.txt /data/picasso
59.
You can now delete the files we created to test the raycasting:
(env1) [ec2-user@ip-10-0-5-43 data] $ cd picasso/20181105

(env1) [ec2-user@ip-10-0-5-43 20181105] $ rm session*/eyelink*hkl

(env1) [ec2-user@ip-10-0-5-43 20181105] $ cd session01

(env1) [ec2-user@ip-10-0-5-43 session01] $ rm *.hkl *.csv bin*hdf VirtualMaze* *.txt
60.
At this point, you should take a snapshot of the /data volume from your computer, so you will not have to go through the set up again:
(aws) $ update_snapshot.sh data 2 MyCluster01
You can move on to the next section while waiting for the snapshot to be completed. Once the snapshot is completed, you should receive an email notification from AWS.
Part 8. Setting up the data pipeline
61.
We are now ready to set up the data pipeline. We will want to create the objects in this order:
- RPLParallel (for both session01 and sessioneye)
- RPLSplit to create a RPLRaw object for each of the 110 channels (for both session01 and sessioneye)
- RPLLFP (which needs the RPLRaw object) for each of the 110 channels (for both session01 and sessioneye)
- RPLHighPass (which needs the RPLRaw object) for each of the 110 channels (for both session01 and sessioneye)
- Spike sorting (which needs the RPLHighPass objects for both session01 and sessioneye) for each of the 110 channels
- Unity (needs RPLParallel object)
- EDFSplit to create Eyelink objects (needs RPLParallel, and Unity if available) (for both session01 and sessioneye)
- Aligning_objects (needs RPLParallel, Unity, and Eyelink objects)
- Raycasting (needs Unity and Eyelink objects)
62.
We will first create a script for submitting jobs to a queue by creating a copy of the script you used in Lab 2, and editing it:
(env1) [ec2-user@ip-10-0-5-43 data] $ cd /data/src/PyHipp

(env1) [ec2-user@ip-10-0-5-43 PyHipp] $ cp slurm.sh pipeline-slurm.sh

(env1) [ec2-user@ip-10-0-5-43 PyHipp] $ nano pipeline-slurm.sh
63.
We will now want to enter what we did above in ipython into the script, but we will just process 8 channels instead of the full 110 channels. However, what we did above involved changing directories numerous times, and that involved processing only one out of the 110 neural channels recorded. We will need to change directories quite a few times if we wanted to process 8 or 110 channels. So instead, we will make use of a command called processDirs in the DataProcessingTools that will automatically change directory to the appropriate directory in which to create the specified objects. In addition, we will want to take note of the time taken to process the data. You can copy and paste the following lines to the end of the file
python -u -c "import PyHipp as pyh; \
import DataProcessingTools as DPT; \
import os; \
import time; \
t0 = time.time(); \
print(time.localtime()); \
DPT.objects.processDirs(dirs=None, objtype=pyh.RPLParallel, saveLevel=1); \
DPT.objects.processDirs(dirs=None, objtype=pyh.RPLSplit, channel=[9, 31, 34, 56, 72, 93, 119, 120]); \
DPT.objects.processDirs(dirs=None, objtype=pyh.RPLLFP, saveLevel=1); \
DPT.objects.processDirs(dirs=None, objtype=pyh.RPLHighPass, saveLevel=1); \
DPT.objects.processDirs(dirs=None, objtype=pyh.Unity, saveLevel=1); \
pyh.EDFSplit(); \
os.chdir('session01'); \
pyh.aligning_objects(); \
pyh.raycast(1); \
DPT.objects.processDirs(level='channel', cmd='import PyHipp as pyh; from PyHipp import mountain_batch; mountain_batch.mountain_batch(); from PyHipp import export_mountain_cells; export_mountain_cells.export_mountain_cells();'); \
print(time.localtime()); \
print(time.time()-t0);"

aws sns publish --topic-arn arn:aws:sns:ap-southeast-1:xxxxxx:awsnotify --message "JobDone"
When the processDirs function is called with level and cmd arguments, it will find all the subdirectories that are at the appropriate level in the data hierarchy (in this case channel directories), and run the specified command in those directories. This will create a job that will perform the spike sorting and save the appropriate spiketrain files into cell directories as discussed in the lecture.
The last Python command will take the difference in time between the start and the end of the job, and print out the difference in the form of number of seconds.
We will also edit the following line in the file to give the job more time (24 hours) to run:
#SBATCH --time=24:00:00 # walltime
as well as to make the job name and the slurm output files more distinct:
#SBATCH -J "pipe"   # job name

#SBATCH -o pipe-slurm.%N.%j.out # STDOUT
#SBATCH -e pipe-slurm.%N.%j.err # STDERR
64.
Save the file, and change directory to the 20181105 data directory:
(env1) [ec2-user@ip-10-0-5-43 PyHipp]$ cd /data/picasso/20181105
Part 9. Executing the data pipeline
65.
You are now ready to submit the script to the slurm queue:
(env1) [ec2-user@ip-10-0-5-43 20181105] $ sbatch /data/src/PyHipp/pipeline-slurm.sh
66.
You can use the squeue function to watch the progress of the job:
(env1) [ec2-user@ip-10-0-5-43 20181105] $ squeue

JOBID   PARTITION    NAME       USER    ST    TIME   NODES  NODELIST(REASON)
    2      queue1    pipe   ec2-user    PD    0:00       1        (Priority)
The last column will say (Priority) when the job is first queued, and switch to (Resources) when the compute node is starting up. When the job starts running on the compute node, the last column will now state the address of the compute node, and the ST (status) column will change from PD (pending), to CF (configuring), to R (running):
JOBID  PARTITION     NAME      USER   ST     TIME  NODES  NODELIST(REASON)
    2     queue1     pipe  ec2-user    R     0:00      1  ip-10-0-1-245
You can also use the following function to track the progress of the job by checking the slurm output file (the number in the name of the .out file corresponds to your Job ID above, so you may have to modify the command below to match your Job ID):
(env1) [ec2-user@ip-10-0-5-43 20181105] $ tail -f pipe-slurm.*.2.out
The tail function will show you the last 10 lines of the file or files you specify, and adding the -f argument will cause it to continue to monitor the files, and print out new lines as they are added to the files. This allows you to monitor the progress of the jobs by looking at their outputs. You can type Ctrl-C at any point to get out of the tail function.
67.
If you make a mistake, you can cancel jobs by specifying the job number:
(env1) [ec2-user@ip-10-0-5-43 20181105] $ scancel 2
The command above will cancel job #2. You can cancel a range of jobs by doing:
(env1) [ec2-user@ip-10-0-5-43 20181105] $ scancel {2..7}
or all jobs by doing:
(env1) [ec2-user@ip-10-0-5-43 20181105] $ scancel --user=ec2-user
68.
If it is taking a long time (more than 10 mins) for the jobs to start running, it could be because there are no servers available with the compute nodes you specified. In this case, you can switch to one of the other instance types for your compute nodes that has more than 64 GB of memory, but do take note of the price differences, which will consume your AWS credits at a faster rate.
If you do not have any jobs running, you can use the following command on your computer to change the instance type of your compute nodes after editing the config file without having to delete and re-create the cluster:
(aws) $ pcluster update-compute-fleet --status STOP_REQUESTED -n MyCluster01

(aws) $ pcluster update-cluster -c ~/cluster-config.yaml -n MyCluster01
You can find more information about pcluster update from:
69.
It will take some time for the job to finish, so you can wait till you receive the email notification that your job has been completed to continue.
Part 10. Checking the output
70.
Once the job has been completed, you should see the following items in the day directory:
(env1) [ec2-user@ip-10-0-5-43 20181105] $ ls

181105.edf  pipe-slurm.ip-xxx.2.err  sessioneye
mountains   pipe-slurm.ip-xxx.2.out
P11_5.edf   session01
You should see the following items in the session01 directory:
(env1) [ec2-user@ip-10-0-5-43 20181105] $ ls session01

181105_Block1.nev  binData.hdf           slist.txt
181105_Block1.ns5  eyelink_24d5.hkl      unity_71bf.hkl
array01            logs.txt              unityfile_eyelink.csv
array02            missingData.csv       VirtualMazeBatchLog.txt
array03            RawData_T1-400
array04            rplparallel_d41d.hkl
In total, we expect the following .hkl files to be created:
session01: rplparallel, unity, eyelink
8 channel directories: rplraw, rpllfp, rplhighpass
sessioneye: rplparallel, eyelink
8 channel directories: rplraw, rpllfp, rplhighpass
which adds up to 53. There will also be some spiketrain .hkl files, but the number returned for each channel is not predictable.
So we can do the following to find all the .hkl files:
(env1) [ec2-user@ip-10-0-5-43 20181105] $ find . -name "*.hkl"
The find command is a very useful function that can help find files using different parameters. In this case, we are asking it to start from the current directory (the . in the second argument) and look for files with names ending in .hkl.
In order to leave out the spiketrain .hkl files, we can send the output of the above command to the grep function using the pipe feature | in the shell. The grep function looks for lines containing matching strings (specified by the -e argument) inside a file or from the output of another function sent to it via a pipe. However, when we specify the -v argument, it will instead look for lines that do not contain the matching strings.
So in the command below, by specifying -v -e spiketrain -e mountains, the grep function will only return lines that do not contain “spiketrain” nor “mountains”, which will allow us to select only the files returned by the find function that do not contain spiketrain or mountains in their names:
(env1) [ec2-user@ip-10-0-5-43 20181105] $ find . -name "*.hkl" | grep -v -e spiketrain -e mountains
We can count the number of files by again piping the output above to the wc command to make sure they were all created properly:
(env1) [ec2-user@ip-10-0-5-43 20181105] $ find . -name "*.hkl" | grep -v -e spiketrain -e mountains | wc -l

53
We can also do the following to make sure that the file sizes look correct:
(env1) [ec2-user@ip-10-0-5-43 20181105] $ find . -name "*.hkl" | grep -v -e spiketrain -e mountains | xargs ls -hl

-rw-rw-r-- 1 ec2-user ec2-user 129M Aug 10 17:20
./session01/eyelink_24d5.hkl

-rw-rw-r-- 1 ec2-user ec2-user  61K Aug 10 13:55
./session01/rplparallel_d41d.hkl

-rw-rw-r-- 1 ec2-user ec2-user  12M Aug 10 17:20
unity_71bf.hkl

-rw-rw-r-- 1 ec2-user ec2-user 630M Aug 11 02:28
./session01/array01/channel009/rplhighpass_b59f.hkl

-rw-rw-r-- 1 ec2-user ec2-user  22M Aug 11 02:27
./session01/array01/channel009/rpllfp_6eca.hkl

-rw-rw-r-- 1 ec2-user ec2-user 630M Aug 11 02:18
./session01/array01/channel009/rplraw_d41d.hkl
Task
Include a screenshot of your Terminal window with the file sizes above in your lab report. Make sure you increase the size of your Terminal window so that the size of all 53 files can be captured in the screenshot.
The xargs function used in the command above takes the output of the grep function, and appends them as arguments to the end of the call to the ls function. For instance, if the grep function returns:
$ find . -name "*.hkl" | grep -v -e spiketrain -e mountains

./session01/eyelink_24d5.hkl
./session01/rplparallel_d41d.hkl
Using xargs will be the equivalent of:
$ ls -hl ./session01/eyelink_24d5.hkl ./session01/rplparallel_d41d.hkl
For session01, the rplraw and rplhighpass files are typically over 600 MB, while the rpllfp files are around 20 MB. The unity files are typically around 10 MB, and the eyelink files are typically over 100 MB. The files in the sessioneye directory are typically quite a bit smaller.
In order to check the output of the spike sorting, we would expect one of these files to be created for each channel:
(env1) [ec2-user@ip-10-0-5-43 20181105] $ find mountains -name "firings.mda" | wc -l

8
Task
Include a screenshot of your terminal window with the output above in your lab report.
71.
You can check the time taken to complete the job by looking for the printouts of time in the output file for the job:
(env1) [ec2-user@ip-10-0-5-43 20181105] $ tail pipe-slurm*.out
Task
Include the output of the command above in your lab report, and convert the time taken for the job to hours, minutes, and seconds so it is easy to understand. Extrapolate from the time taken for 8 channels to estimate how long it will take to process all 110 channels.
Part 11. Wrapping up
72.
Once you are done, you can exit your cluster, and then update your snapshot:
(aws) $ update_snapshot.sh data 2 MyCluster01
73.
Once you receive the email notification, you can delete the cluster:
(aws) $ pcluster delete-cluster -n MyCluster01
74.
In the next lab, we will look at ways to parallelize the data processing.
75.
In the Part A, we started the process of setting up an AWS Budget to warn you when your credits are running low. You can now resume by going to your Billing Dashboard:
Click on Budget in the left panel:
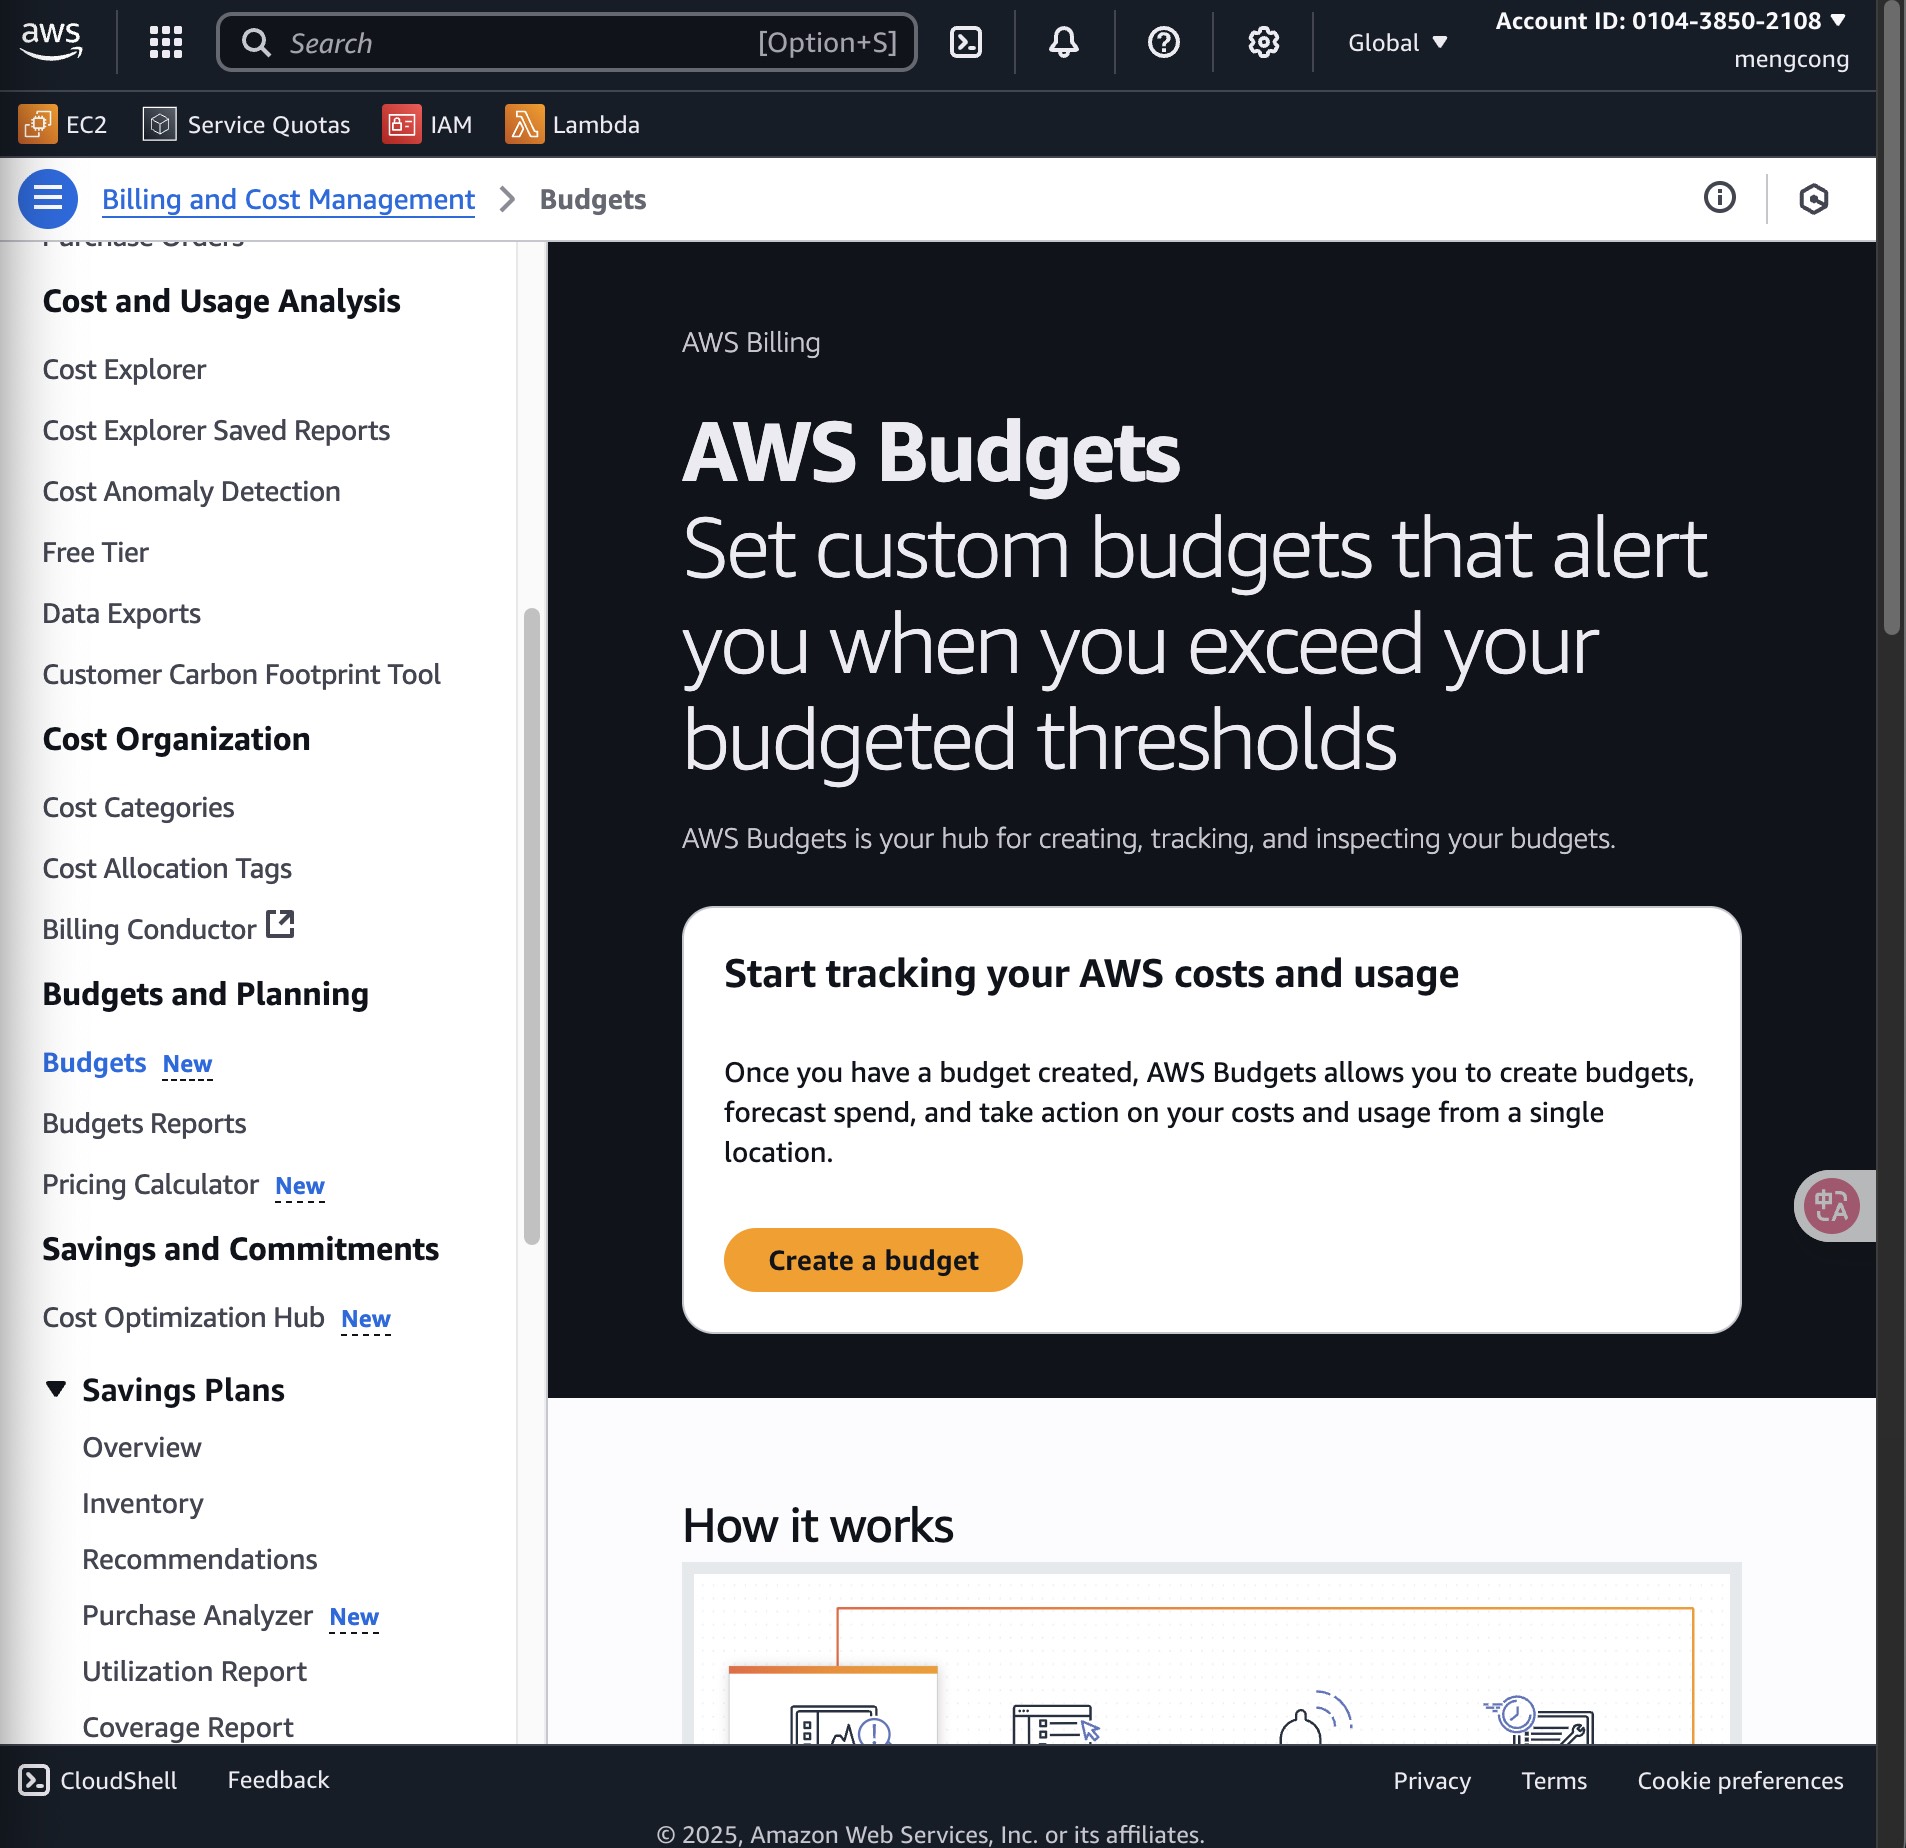
Click on the Create a budget button:

Choose Customize (advanced) under Budget setup, select the Cost budget - Recommended option, and scroll down to click the Next button:

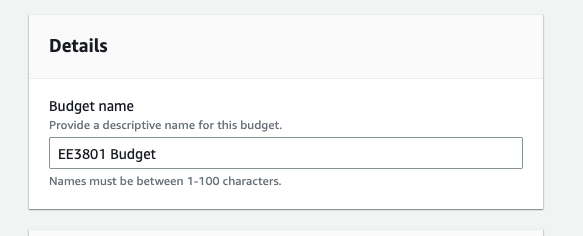
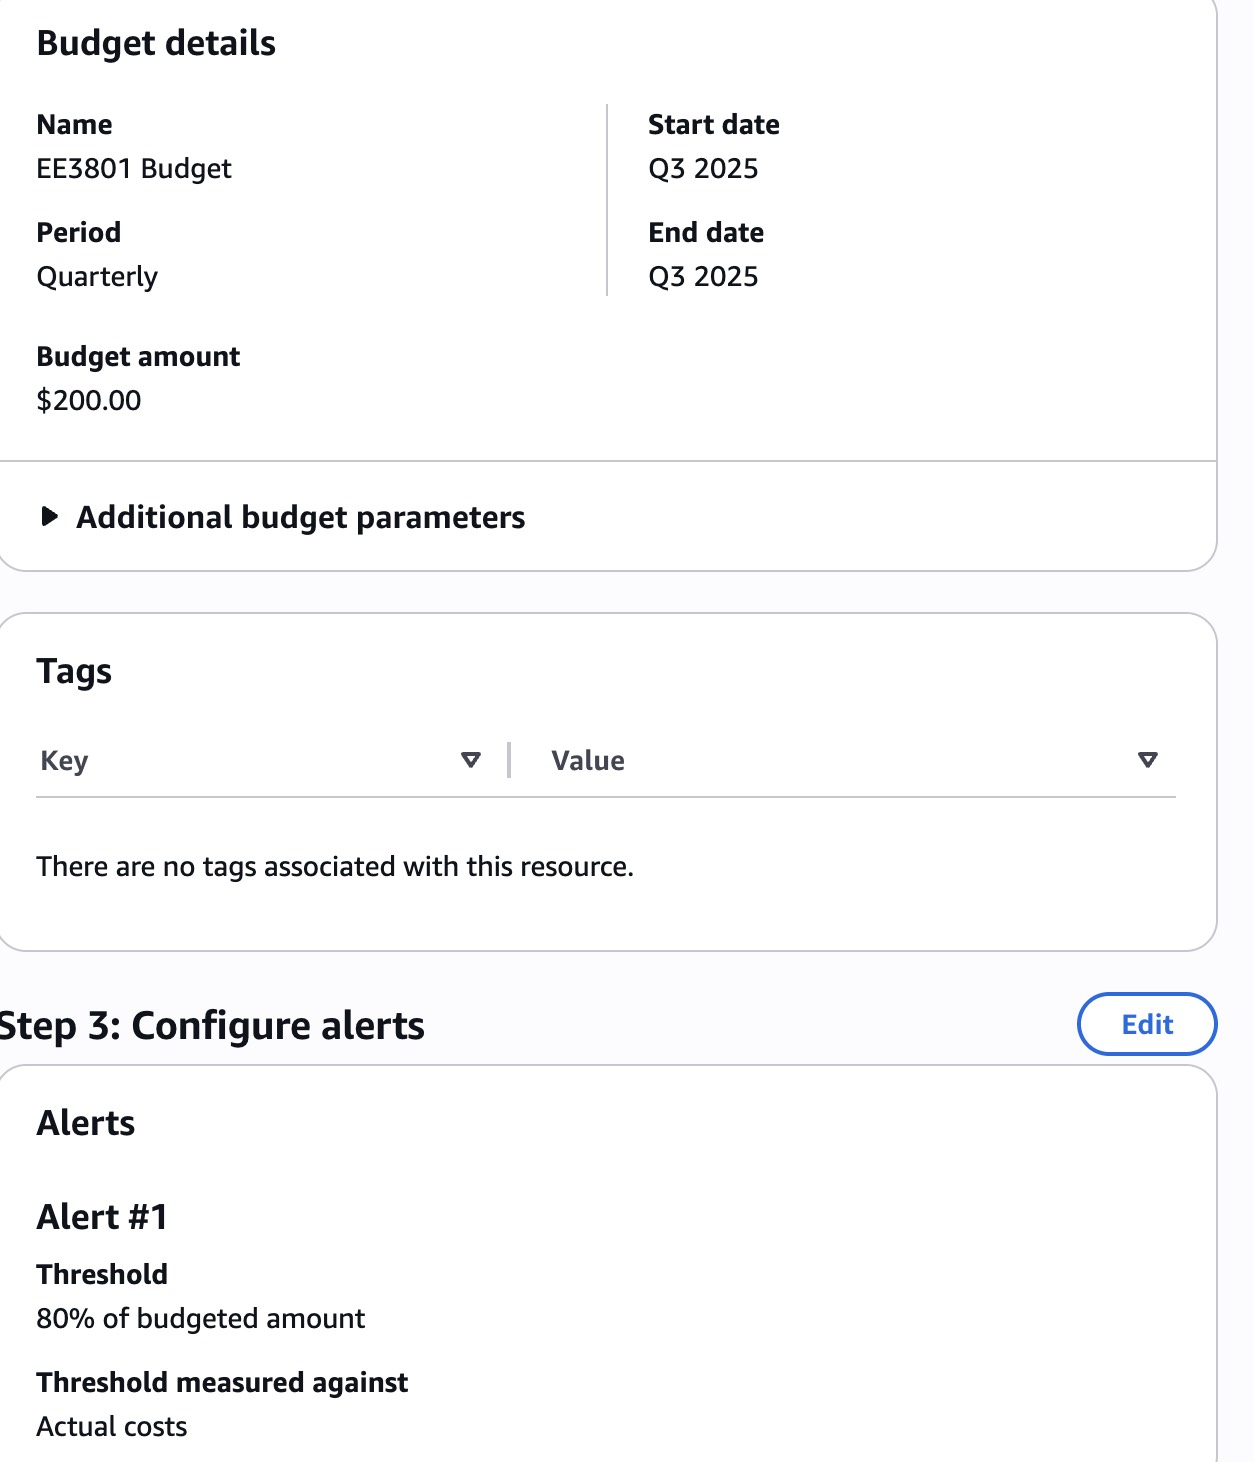
Scroll down and name the budget as follow:
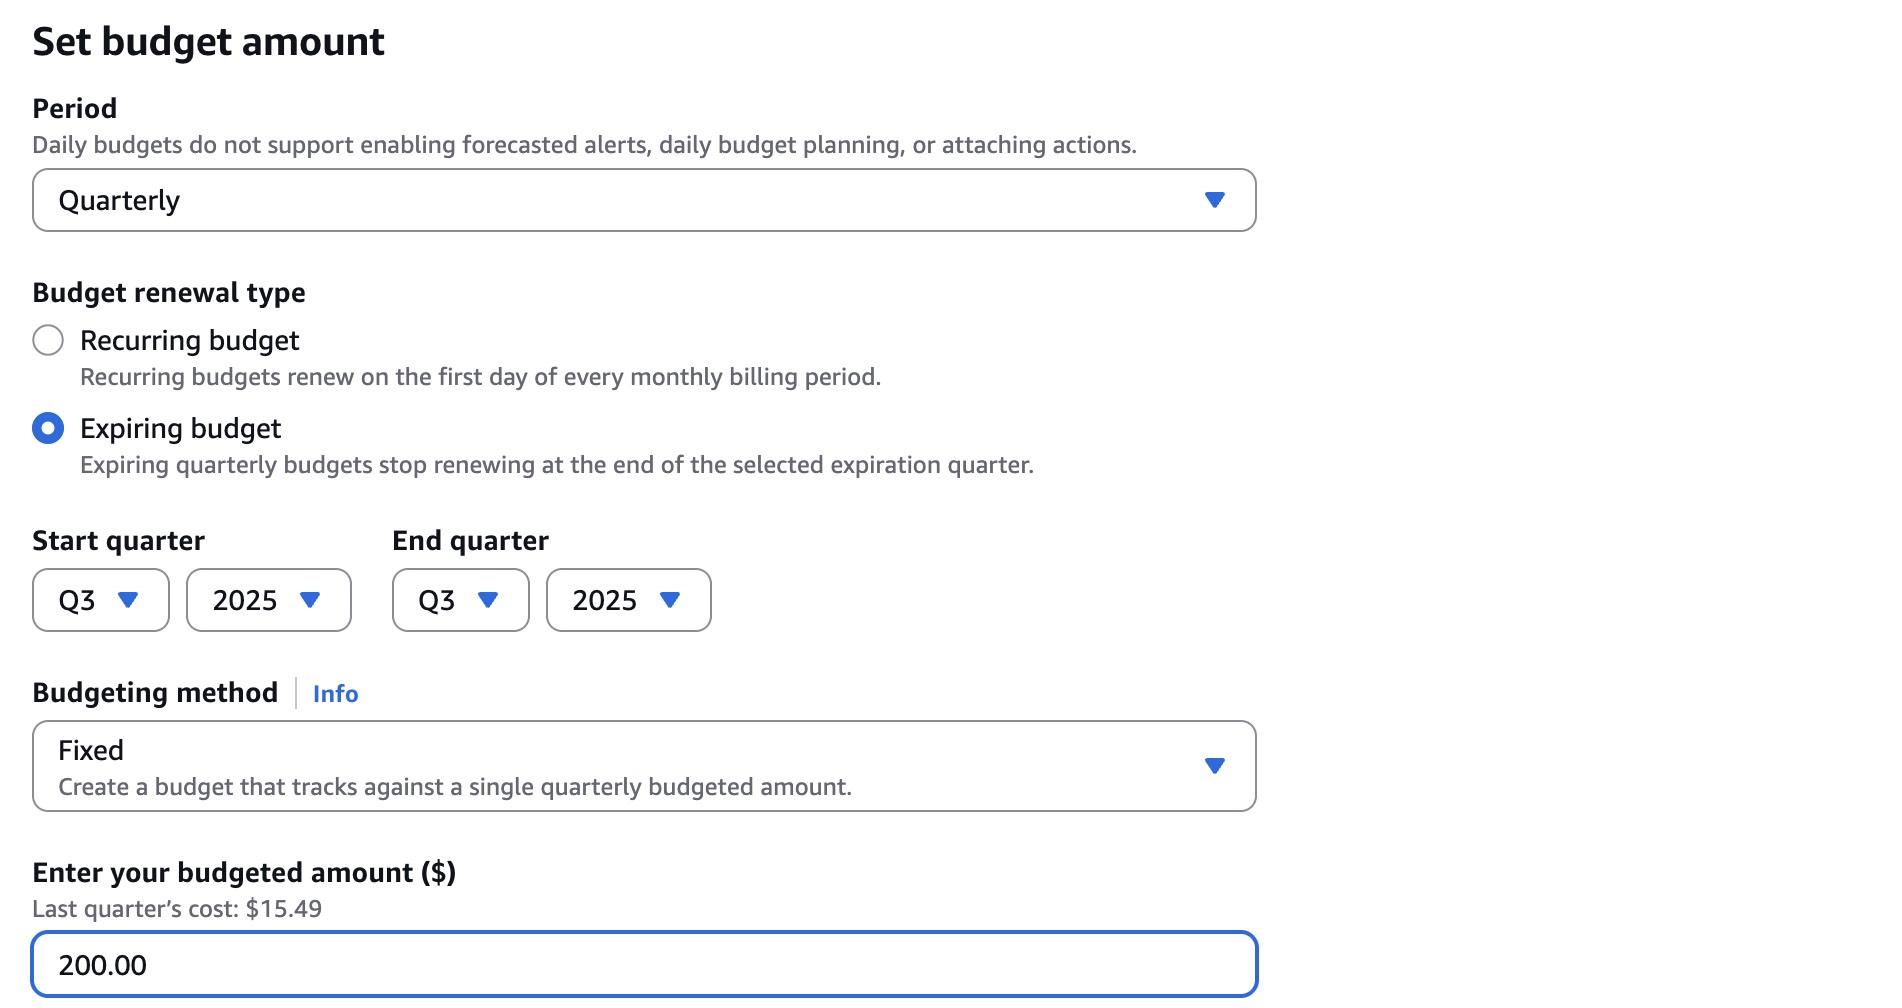
Scroll down to the Set budget amount section, select Quarterly under Period, Expiring budget under Budget effective date, Q3 and 2025 under Start quarter, Q3 and 2025 under End quarter, Fixed under Choose how to budget, and enter 200.00 in Enter your budgeted amount ($):
Scroll down and click Next.
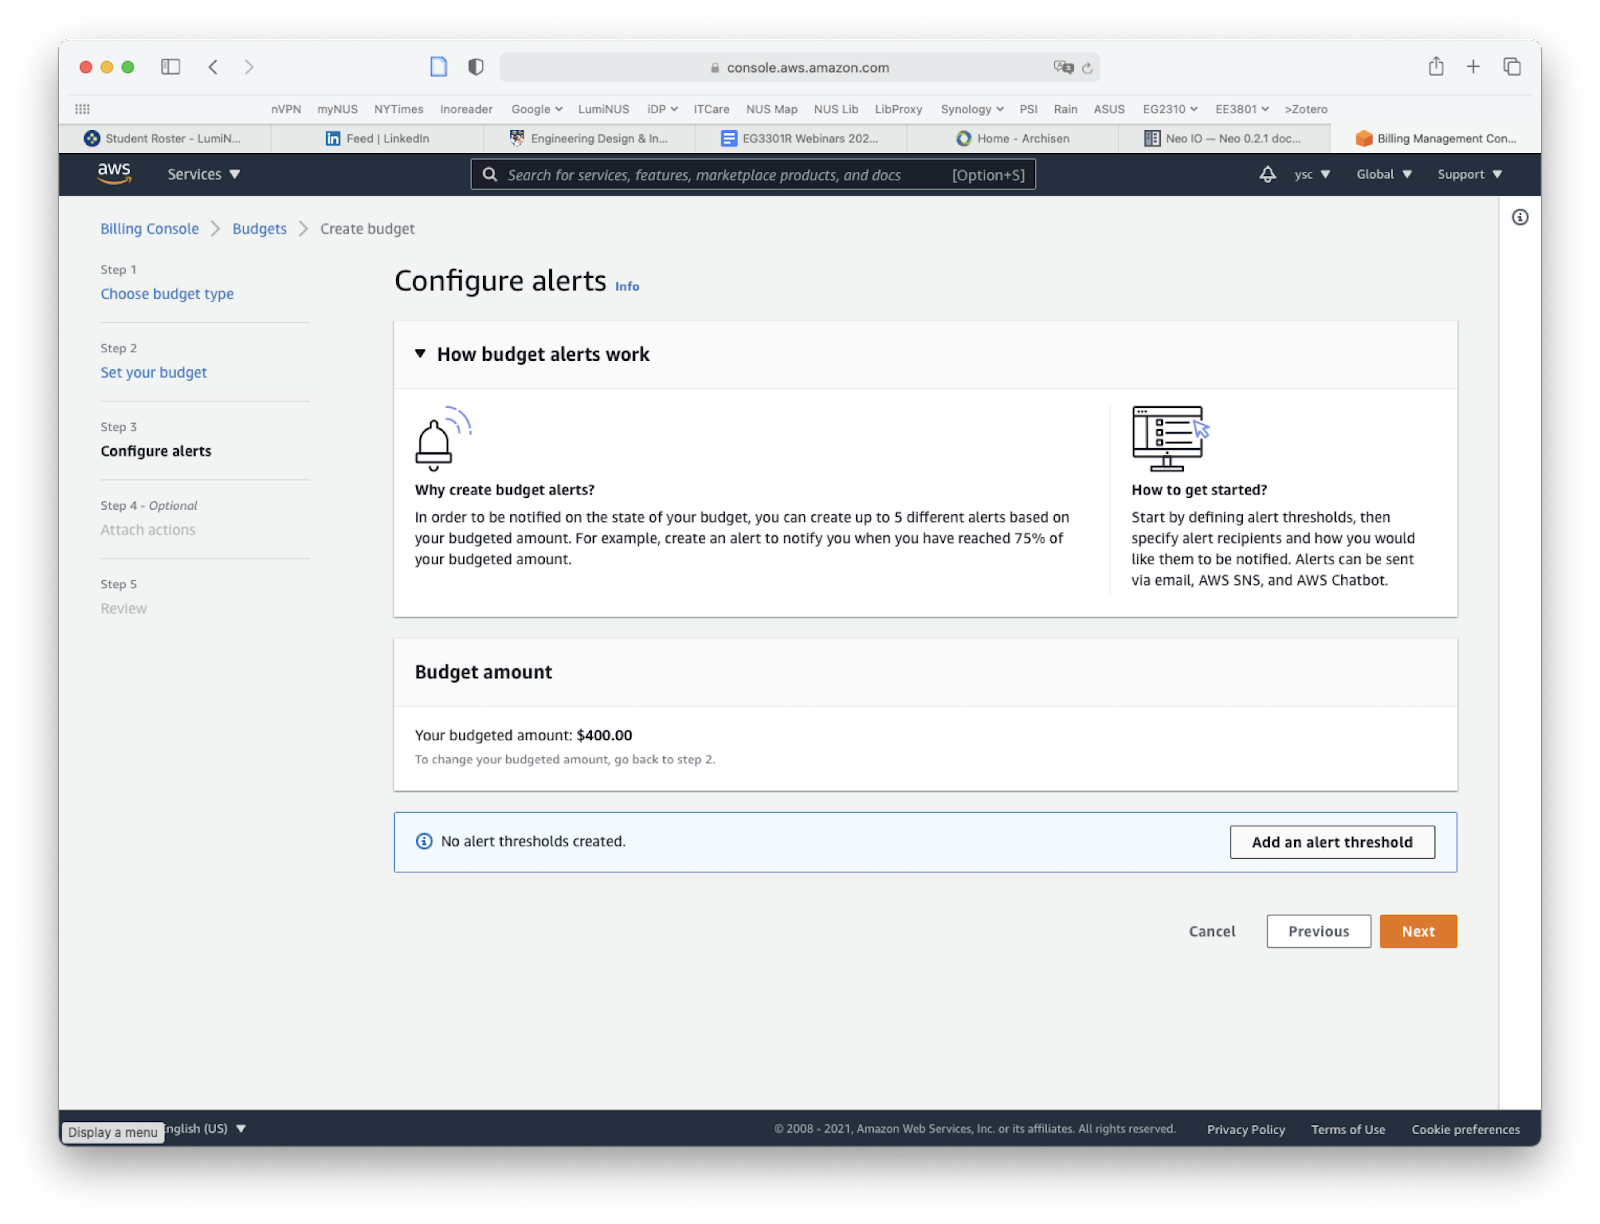
Click on the “Add an alert threshold” button:
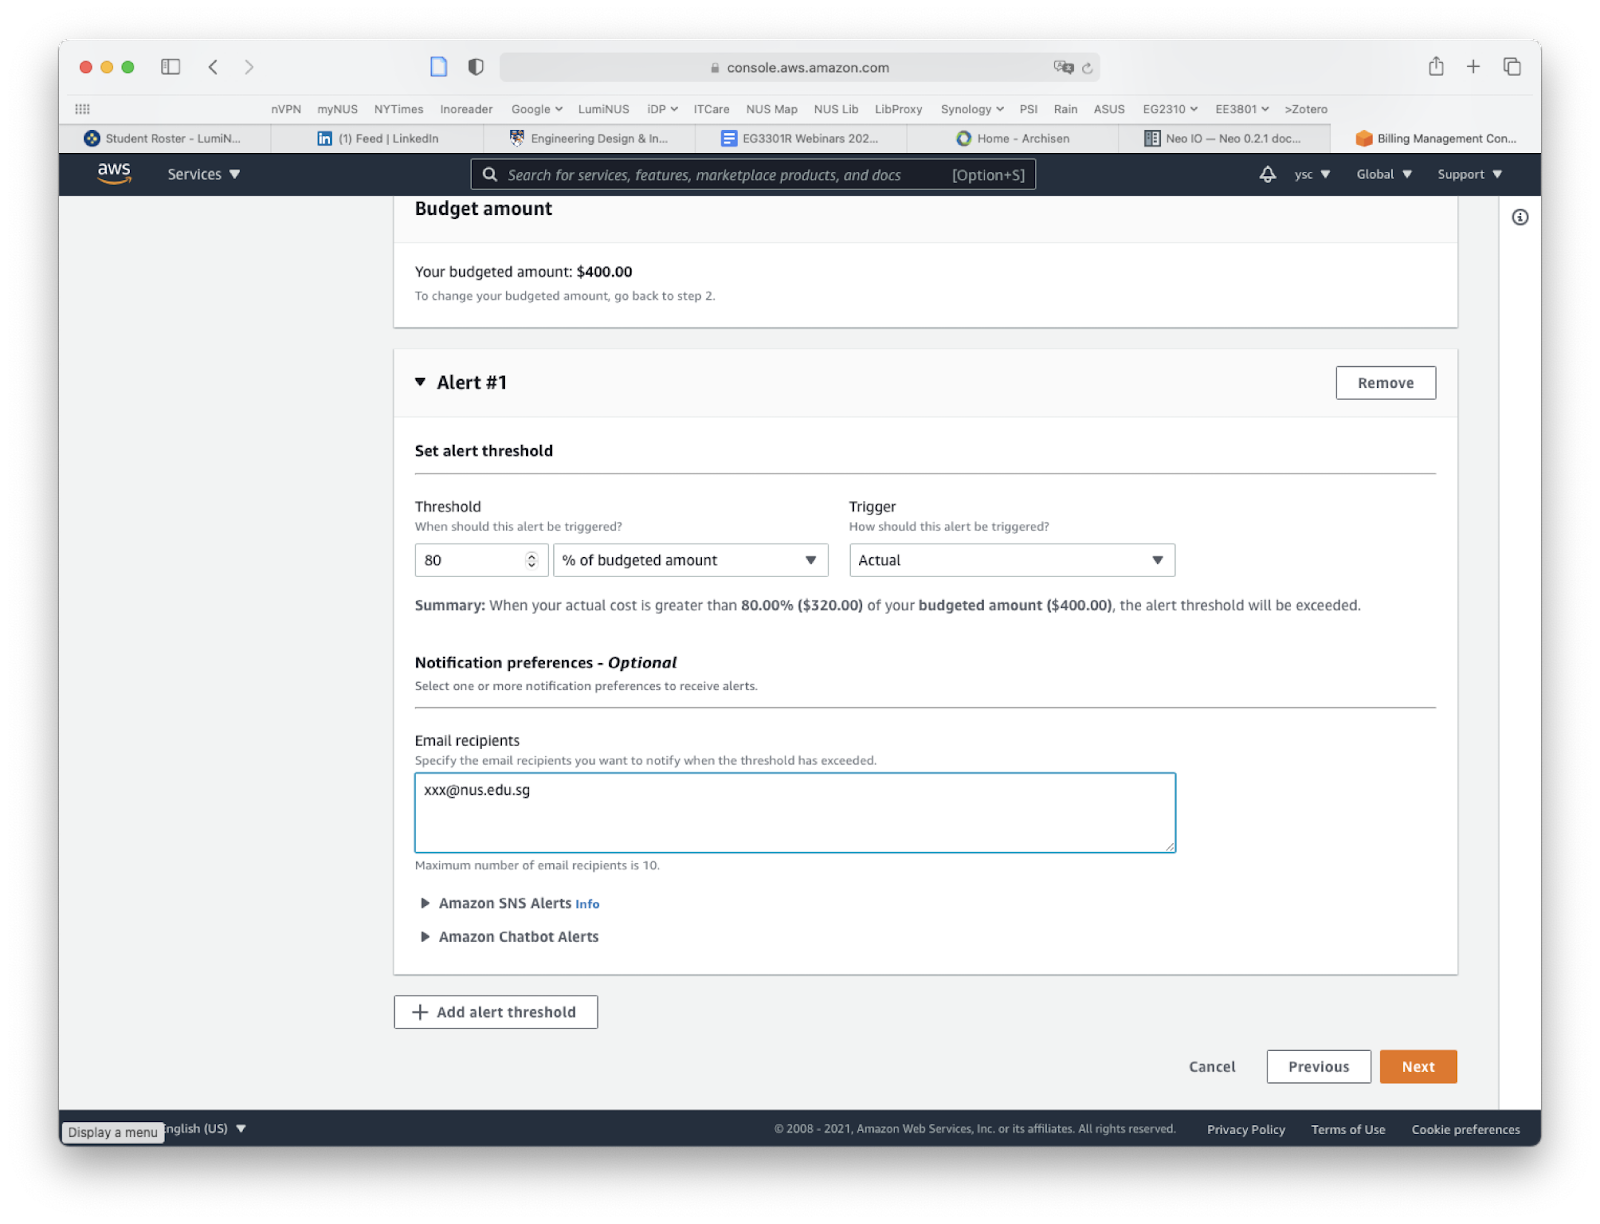
Enter “80” under “Threshold”, fill in your email address under “Email recipients”, click the “Next” button at the bottom of the page:
Click on the “Next” button to skip the “Attach actions” section:
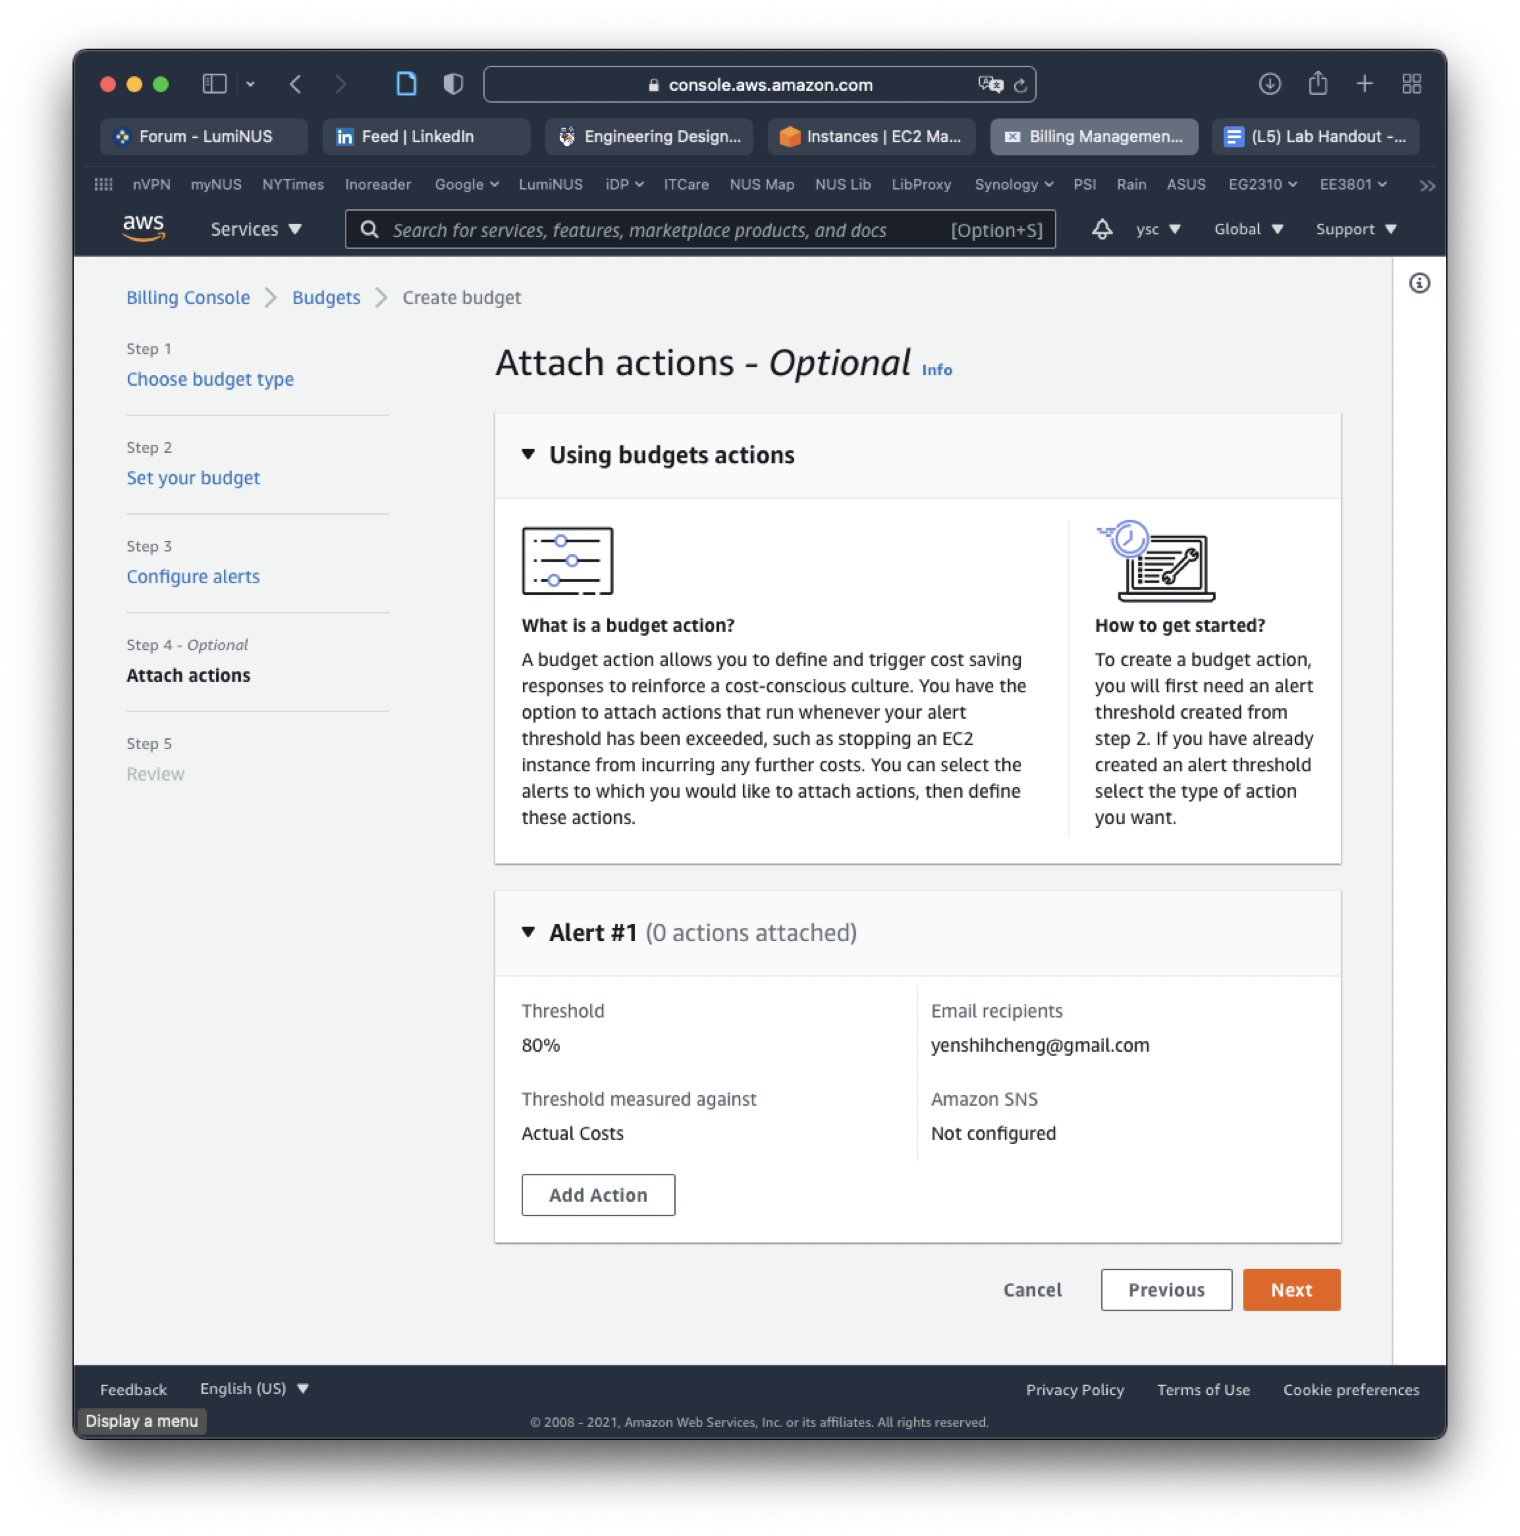
Review your entries, and click the “Create budget” at the bottom of the page:
This will take you back to the budgets page to show you the budget you created:
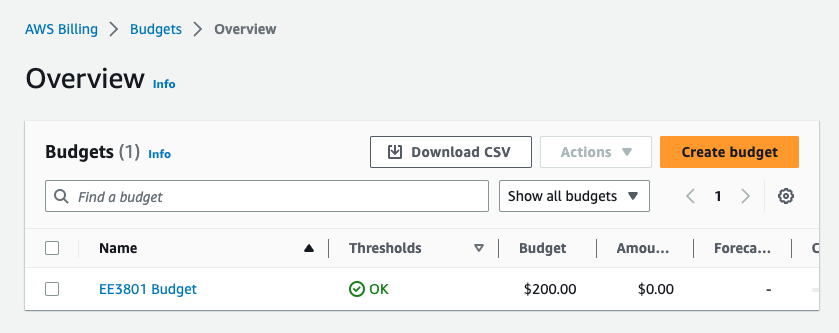
You will now get an email warning when your charges exceed 80% of your credits.
Task
Include a screenshot of your budget page in your lab report.